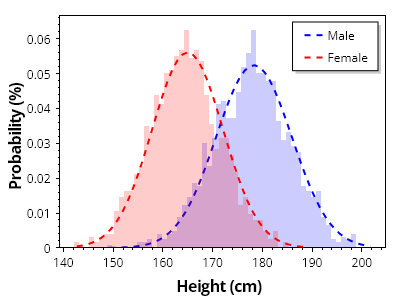
複数のヒストグラム
半透明のバーを使用して、重なり合うデータセットのヒストグラムを表示する方法を示します
ScottPlot.Plot myPlot = new();

// 値のコレクションからヒストグラムを作成する
double[][] heightsByGroup = { SampleData.MaleHeights(), SampleData.FemaleHeights() };
string[] groupNames = { "男性", "女性" };
Color[] groupColors = { Colors.Blue, Colors.Red };

for (int i = 0; i < 2; i++)
{
    double[] heights = heightsByGroup[i];
    var hist = ScottPlot.Statistics.Histogram.WithBinSize(1, heights);

    // ヒストグラムを棒グラフとして表示する
    var barPlot = myPlot.Add.Bars(hist.Bins, hist.GetProbability());

    // 各バーのスタイルをカスタマイズする
    foreach (var bar in barPlot.Bars)
    {
        bar.Size = hist.FirstBinSize;
        bar.LineWidth = 0;
        bar.FillStyle.AntiAlias = false;
        bar.FillColor = groupColors[i].WithAlpha(.2);
    }

    // ヒストグラムの上に確率曲線をプロットする
    ScottPlot.Statistics.ProbabilityDensity pd = new(heights);
    double[] xs = Generate.Range(heights.Min(), heights.Max(), 1);
    double scale = 1.0 / hist.Bins.Select(x => pd.GetY(x)).Sum();
    double[] ys = pd.GetYs(xs, scale);

    var curve = myPlot.Add.ScatterLine(xs, ys);
    curve.LineWidth = 2;
    curve.LineColor = groupColors[i];
    curve.LinePattern = LinePattern.DenselyDashed;
    curve.LegendText = groupNames[i];
}

// プロットのスタイルをカスタマイズする
myPlot.Legend.Alignment = Alignment.UpperRight;
myPlot.Axes.Margins(bottom: 0);
myPlot.YLabel("確率 (%)");
myPlot.XLabel("身長 (cm)");
myPlot.HideGrid();

myPlot.SavePng("demo.png", 400, 300);
このレシピは、ヒストグラムカテゴリにある多数のレシピのうちの1つです