一般
Example plots shown next to the code used to create them
カテゴリ
- グリッドのカスタマイズ
- 目盛りのカスタマイズ
- その他
- 複数の軸
- 色
- プロット可能オブジェクトの管理
- 軸と目盛り
- 凡例
- プロットのスタイル設定
- サンプルデータ
- ヒストグラム
- 国際化
- カーネル密度推定
- レイアウト
- Multiplot
- 回帰
- クイックスタート
- アノテーション
- 矢印
- 軸線
- 軸スパン
- 棒グラフ
- 箱ひげ図
- Bracket
- コールアウト
- 等高線図
- Coxcomb プロット
- Crosshair
- 楕円
- 誤差バー
- FillY プロット
- 金融プロット
- Function
- ヒートマップ
- 画像
- インタラクティブ
- ラインプロット
- ライブデータ
- Lollipopプロット
- マーカー
- フェーザープロット
- 円グラフ
- 極座標軸
- 母集団プロット
- レーダープロット
- ラジアルゲージ
- スケールバー
- 散布図
- 図形
- シグナルプロット
- SignalConst
- SignalXY プロット
- スミスチャート
- テキスト
- ツールチップ
- 三角軸
- ベクトル場
- api
グリッドのカスタマイズ
Advanced customization of grid lines
レシピ
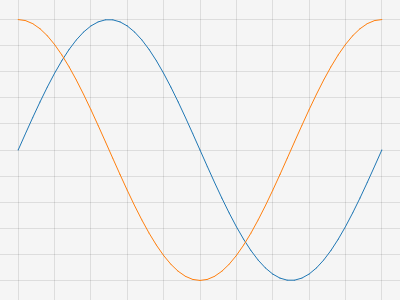
グリッドを非表示にする
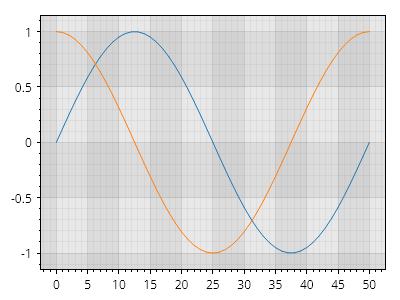
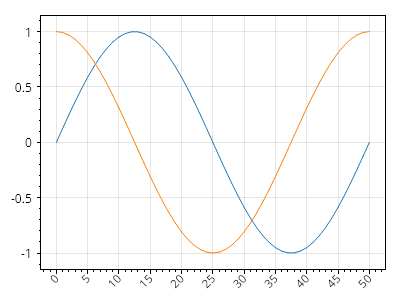
グリッドを非表示にする
グリッド線は非表示にできます。

ScottPlot.Plot myPlot = new();

myPlot.Add.Signal(Generate.Sin(51));
myPlot.Add.Signal(Generate.Cos(51));

myPlot.HideGrid();

myPlot.SavePng("demo.png", 400, 300);
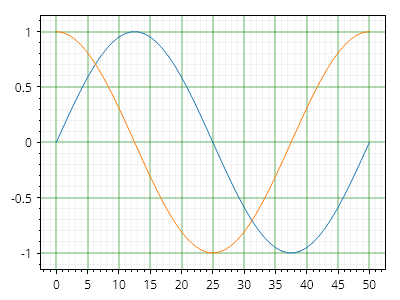
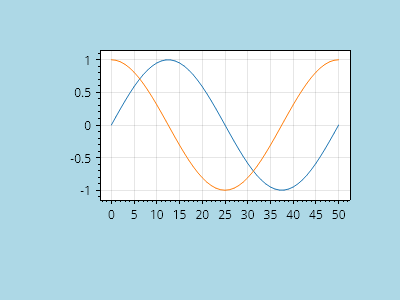
グリッドのカスタマイズ
グリッドのカスタマイズ
グリッド線はカスタマイズできます。開発者がグリッドのレンダリングを完全に制御できるように、カスタムグリッドシステムを作成できますが、デフォルトのグリッドを操作して外観をカスタマイズすることもできます。
ScottPlot.Plot myPlot = new();

myPlot.Add.Signal(Generate.Sin(51));
myPlot.Add.Signal(Generate.Cos(51));

myPlot.Grid.MajorLineColor = Colors.Green.WithOpacity(.3);
myPlot.Grid.MajorLineWidth = 2;

myPlot.Grid.MinorLineColor = Colors.Gray.WithOpacity(.1);
myPlot.Grid.MinorLineWidth = 1;

myPlot.SavePng("demo.png", 400, 300);
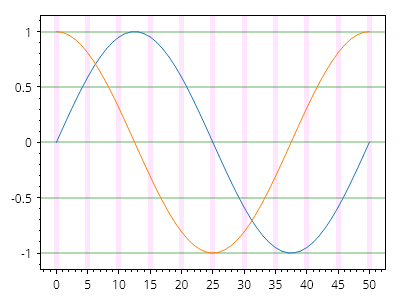
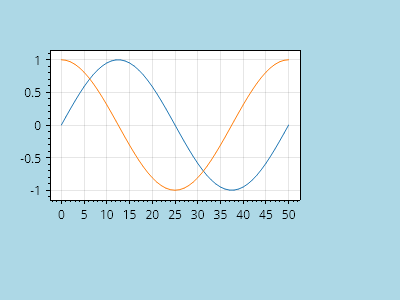
軸固有のグリッドのカスタマイズ
軸固有のグリッドのカスタマイズ
軸固有のスタイルプロパティを使用すると、グリッド線のスタイルを軸ごとに幅広くカスタマイズできます。
ScottPlot.Plot myPlot = new();

myPlot.Add.Signal(Generate.Sin(51));
myPlot.Add.Signal(Generate.Cos(51));

myPlot.Grid.XAxisStyle.MajorLineStyle.Color = Colors.Magenta.WithAlpha(.1);
myPlot.Grid.XAxisStyle.MajorLineStyle.Width = 5;

myPlot.Grid.YAxisStyle.MajorLineStyle.Color = Colors.Green.WithAlpha(.3);
myPlot.Grid.YAxisStyle.MajorLineStyle.Width = 2;

myPlot.SavePng("demo.png", 400, 300);
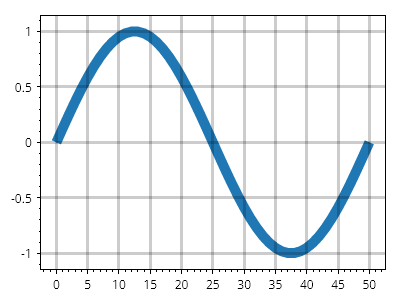
データの上にグリッドを表示
データの上にグリッドを表示
グリッド線は通常データの下に描画されますが、プロット対象の上にレンダリングするようにグリッドを設定することもできます。
ScottPlot.Plot myPlot = new();

var sig = myPlot.Add.Signal(ScottPlot.Generate.Sin());
sig.LineWidth = 10;

myPlot.Grid.MajorLineWidth = 3;
myPlot.Grid.MajorLineColor = Colors.Black.WithAlpha(.2);
myPlot.Grid.IsBeneathPlottables = false;

myPlot.SavePng("demo.png", 400, 300);
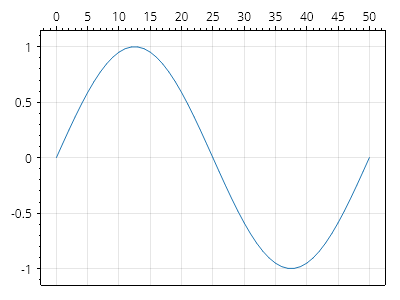
上軸付きグリッド
上軸付きグリッド
グリッド線はデフォルトで下軸と左軸を使用しますが、この動作は他の軸を使用するプロット向けにカスタマイズできます。
ScottPlot.Plot myPlot = new();

var sig = myPlot.Add.Signal(ScottPlot.Generate.Sin());
sig.Axes.XAxis = myPlot.Axes.Top;
myPlot.Grid.XAxis = myPlot.Axes.Top;

myPlot.SavePng("demo.png", 400, 300);
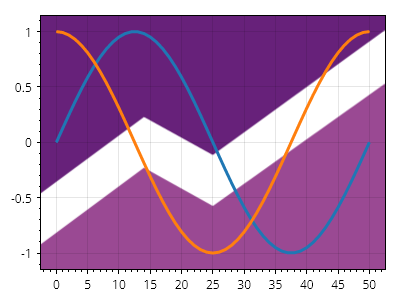
グリッドの塗りつぶし色
グリッドの塗りつぶし色
交互に並ぶ主要グリッド線のペアの間の領域を、ユーザーが指定した色で塗りつぶすことができます
ScottPlot.Plot myPlot = new();

myPlot.Add.Signal(Generate.Sin());
myPlot.Add.Signal(Generate.Cos());

// 主要グリッド線の間の領域を塗りつぶす
myPlot.Grid.XAxisStyle.FillColor1 = Colors.Gray.WithOpacity(0.1);
myPlot.Grid.XAxisStyle.FillColor2 = Colors.Gray.WithOpacity(0.2);
myPlot.Grid.YAxisStyle.FillColor1 = Colors.Gray.WithOpacity(0.1);
myPlot.Grid.YAxisStyle.FillColor2 = Colors.Gray.WithOpacity(0.2);

// 副グリッド線も表示する
myPlot.Grid.XAxisStyle.MinorLineStyle.Width = 1;
myPlot.Grid.YAxisStyle.MinorLineStyle.Width = 1;

myPlot.SavePng("demo.png", 400, 300);
ダークモードでのグリッドの塗りつぶし色
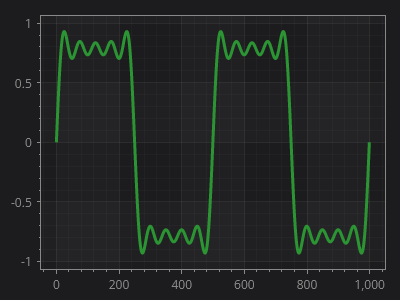
ダークモードでのグリッドの塗りつぶし色
グリッドとプロットのスタイルをカスタマイズすることで、ダークモードで見栄えのよい効果を実現できます
ScottPlot.Plot myPlot = new();

// 緑色のデータ線を追加する
var sig = myPlot.Add.Signal(Generate.SquareWaveFromSines());
sig.LineWidth = 3;
sig.Color = new("#2b9433");
sig.AlwaysUseLowDensityMode = true;

// プロットに暗い背景と明るいテキストを設定する
myPlot.FigureBackground.Color = new("#1c1c1e");
myPlot.Axes.Color(new("#888888"));

// 主要グリッド線の間の領域を塗りつぶす
myPlot.Grid.XAxisStyle.FillColor1 = new Color("#888888").WithAlpha(10);
myPlot.Grid.YAxisStyle.FillColor1 = new Color("#888888").WithAlpha(10);

// グリッド線の色を設定する
myPlot.Grid.XAxisStyle.MajorLineStyle.Color = Colors.White.WithAlpha(15);
myPlot.Grid.YAxisStyle.MajorLineStyle.Color = Colors.White.WithAlpha(15);
myPlot.Grid.XAxisStyle.MinorLineStyle.Color = Colors.White.WithAlpha(5);
myPlot.Grid.YAxisStyle.MinorLineStyle.Color = Colors.White.WithAlpha(5);

// 正の幅を定義して補助グリッド線を有効にする
myPlot.Grid.XAxisStyle.MinorLineStyle.Width = 1;
myPlot.Grid.YAxisStyle.MinorLineStyle.Width = 1;

myPlot.SavePng("demo.png", 400, 300);
目盛りのカスタマイズ
Advanced customization of tick marks and tick labels
レシピ
- カスタム目盛りフォーマッター
- DateTimeAutomatic 目盛りフォーマッター
- カスタム目盛りジェネレーター
- SetTicks ショートカット
- カスタム目盛位置
- カスタム Tick DateTime
- 回転した目盛ラベル
- 長いラベルを持つ回転目盛り
- グリッド線を無効化する
- 最小目盛り間隔
- 目盛りの密度
- 目盛り数
- 補助目盛の密度
- 対数スケールの目盛り
- カスタム目盛りマーク付きの対数スケール
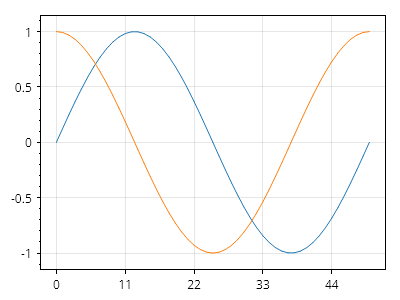
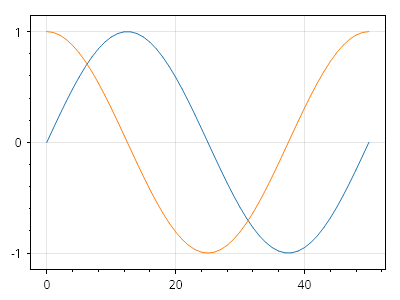
カスタム目盛りフォーマッター
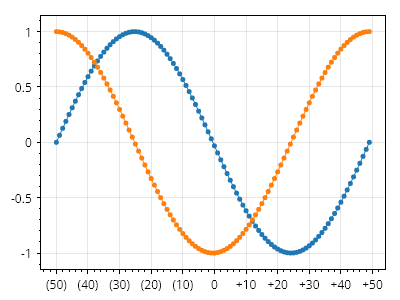
カスタム目盛りフォーマッター
ユーザーは、目盛り位置から目盛りラベルを作成するために使用されるロジックをカスタマイズできます。古いバージョンの ScottPlot では、ManualTickPositions メソッドを使用してこれを実現していました。
ScottPlot.Plot myPlot = new();

double[] xs = Generate.Consecutive(100, 1, -50);
myPlot.Add.Scatter(xs, Generate.Sin(100));
myPlot.Add.Scatter(xs, Generate.Cos(100));

// 文字列フォーマットロジックを含む静的関数を作成する
static string CustomFormatter(double position)
{
    if (position == 0)
        return "0";
    else if (position > 0)
        return $"+{position}";
    else
        return $"({-position})";
}

// カスタムラベルフォーマッターを使用するカスタム目盛りジェネレーターを作成する
ScottPlot.TickGenerators.NumericAutomatic myTickGenerator = new()
{
    LabelFormatter = CustomFormatter
};

// 軸にカスタム目盛りジェネレーターを使用するよう指示する
myPlot.Axes.Bottom.TickGenerator = myTickGenerator;

myPlot.SavePng("demo.png", 400, 300);
DateTimeAutomatic 目盛りフォーマッター
DateTimeAutomatic 目盛りフォーマッター
ユーザーは、目盛り位置から日時の目盛りラベルを作成するために使用されるロジックをカスタマイズできます。
ScottPlot.Plot myPlot = new();

// 水平軸に DateTime 値を使用してデータをプロットする
DateTime[] xs = Generate.ConsecutiveHours(100);
double[] ys = Generate.RandomWalk(100);
myPlot.Add.Scatter(xs, ys);

// 下軸が DateTime 目盛りを使用するように設定する
var axis = myPlot.Axes.DateTimeTicksBottom();

// 文字列を返すカスタムフォーマッターを作成する
// ズームアウト時は日付のみ、ズームイン時は時刻のみ
static string CustomFormatter(DateTime dt)
{
    bool isMidnight = dt is { Hour: 0, Minute: 0, Second: 0 };
    return isMidnight
        ? DateOnly.FromDateTime(dt).ToString()
        : TimeOnly.FromDateTime(dt).ToString();
}

// カスタム目盛りフォーマッターを適用する
var tickGen = (ScottPlot.TickGenerators.DateTimeAutomatic)axis.TickGenerator;
tickGen.LabelFormatter = CustomFormatter;

myPlot.SavePng("demo.png", 400, 300);
カスタム目盛りジェネレーター
カスタム目盛りジェネレーター
目盛りジェネレーターは、目盛りを配置する位置を決定し、目盛り位置から目盛りラベルを生成するロジックも含みます。代替の目盛りジェネレーターを作成して軸に割り当てることができます。ScottPlot には一般的な目盛りジェネレーターがいくつか用意されており、ユーザー独自のものを作成するオプションもあります。
ScottPlot.Plot myPlot = new();

myPlot.Add.Signal(Generate.Sin(51));
myPlot.Add.Signal(Generate.Cos(51));

myPlot.Axes.Bottom.TickGenerator = new ScottPlot.TickGenerators.NumericFixedInterval(11);

myPlot.SavePng("demo.png", 400, 300);
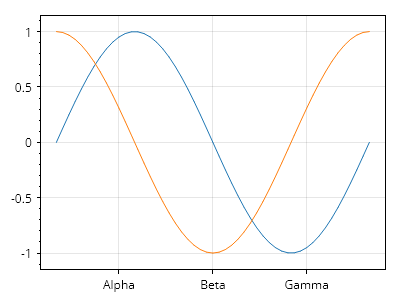
SetTicks ショートカット
SetTicks ショートカット
デフォルトの軸には SetTicks() ヘルパーメソッドがあり、デフォルトの目盛りジェネレーターを、提供された目盛りで事前に読み込まれた手動の目盛りジェネレーターに置き換えます。
ScottPlot.Plot myPlot = new();

// サンプルデータを表示する
myPlot.Add.Signal(Generate.Sin());
myPlot.Add.Signal(Generate.Cos());

// 手動で定義した目盛りを使用する
double[] tickPositions = { 10, 25, 40 };
string[] tickLabels = { "Alpha", "Beta", "Gamma" };
myPlot.Axes.Bottom.SetTicks(tickPositions, tickLabels);

myPlot.SavePng("demo.png", 400, 300);
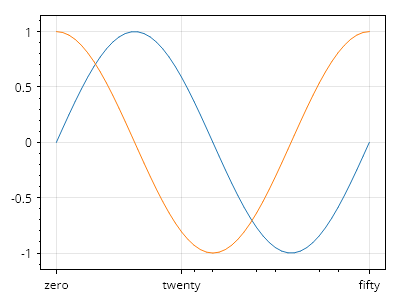
カスタム目盛位置
カスタム目盛位置
主目盛と補助目盛の位置およびラベルをより細かく制御したいユーザーは、手動目盛ジェネレーターをインスタンス化し、必要に応じて設定してから、カスタマイズ対象の軸に割り当てることができます。
ScottPlot.Plot myPlot = new();

// サンプルデータを表示する
myPlot.Add.Signal(Generate.Sin());
myPlot.Add.Signal(Generate.Cos());

// 手動目盛ジェネレーターを作成して目盛を追加する
ScottPlot.TickGenerators.NumericManual ticks = new();

// 主目盛とそのラベルを追加する
ticks.AddMajor(0, "zero");
ticks.AddMajor(20, "twenty");
ticks.AddMajor(50, "fifty");

// 補助目盛を追加する
ticks.AddMinor(22);
ticks.AddMinor(25);
ticks.AddMinor(32);
ticks.AddMinor(35);
ticks.AddMinor(42);
ticks.AddMinor(45);

// 水平軸にカスタム目盛ジェネレーターを使用するよう指示する
myPlot.Axes.Bottom.TickGenerator = ticks;

myPlot.SavePng("demo.png", 400, 300);
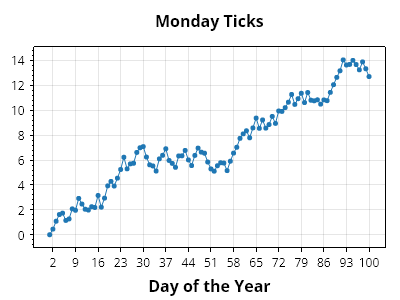
カスタム Tick DateTime
カスタム Tick DateTime
ユーザーは DateTime 単位を使用してカスタム tick を定義できます
ScottPlot.Plot myPlot = new();

DateTime[] dates = Generate.ConsecutiveDays(100);
double[] values = Generate.RandomWalk(100);
myPlot.Add.Scatter(dates, values);

// 手動の DateTime tick ジェネレーターを作成して tick を追加する
ScottPlot.TickGenerators.DateTimeManual ticks = new();

// 月曜日のみ tick を追加する
foreach (DateTime date in dates)
{
    if (date.DayOfWeek == DayOfWeek.Monday)
    {
        string label = date.DayOfYear.ToString();
        ticks.AddMajor(date, label);
    }
}

// 水平軸にカスタム tick ジェネレーターを使用するよう指示する
myPlot.Axes.Bottom.TickGenerator = ticks;

// プロットのスタイルを設定する
myPlot.Title("月曜日の Tick");
myPlot.XLabel("年の通算日");

myPlot.SavePng("demo.png", 400, 300);
回転した目盛ラベル
回転した目盛ラベル
ユーザーは目盛ラベルの回転をカスタマイズできます。
ScottPlot.Plot myPlot = new();

myPlot.Add.Signal(Generate.Sin());
myPlot.Add.Signal(Generate.Cos());

myPlot.Axes.Bottom.TickLabelStyle.Rotation = -45;
myPlot.Axes.Bottom.TickLabelStyle.Alignment = Alignment.MiddleRight;

myPlot.SavePng("demo.png", 400, 300);
長いラベルを持つ回転目盛り
長いラベルを持つ回転目盛り
軸のサイズを大きくすることで、回転した目盛りラベルや長い目盛りラベルに対応できます。
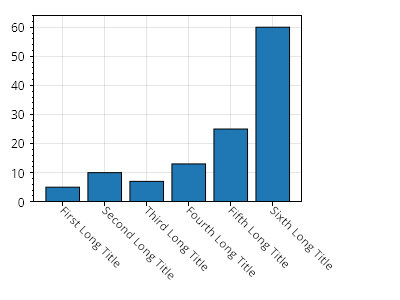
ScottPlot.Plot myPlot = new();

// 棒グラフを作成する
double[] values = { 5, 10, 7, 13, 25, 60 };
myPlot.Add.Bars(values);
myPlot.Axes.Margins(bottom: 0);

// 各棒に目盛りを作成する
Tick[] ticks =
{
    new(0, "1つ目の長いタイトル"),
    new(1, "2つ目の長いタイトル"),
    new(2, "3つ目の長いタイトル"),
    new(3, "4つ目の長いタイトル"),
    new(4, "5つ目の長いタイトル"),
    new(5, "6つ目の長いタイトル")
};
myPlot.Axes.Bottom.TickGenerator = new ScottPlot.TickGenerators.NumericManual(ticks);
myPlot.Axes.Bottom.TickLabelStyle.Rotation = 45;
myPlot.Axes.Bottom.TickLabelStyle.Alignment = Alignment.MiddleLeft;

// 最大の目盛りラベルの幅を判定する
float largestLabelWidth = 0;
using Paint paint = Paint.NewDisposablePaint();
foreach (Tick tick in ticks)
{
    PixelSize size = myPlot.Axes.Bottom.TickLabelStyle.Measure(tick.Label, paint).Size;
    largestLabelWidth = Math.Max(largestLabelWidth, size.Width);
}

// 軸パネルが最大ラベルより小さくならないようにする
myPlot.Axes.Bottom.MinimumSize = largestLabelWidth;
myPlot.Axes.Right.MinimumSize = largestLabelWidth;

myPlot.SavePng("demo.png", 400, 300);
グリッド線を無効化する
グリッド線を無効化する
ユーザーは、特定の軸のグリッド線を無効化できます。
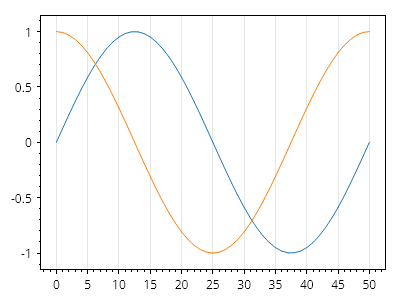
ScottPlot.Plot myPlot = new();

myPlot.Add.Signal(Generate.Sin());
myPlot.Add.Signal(Generate.Cos());

myPlot.Grid.XAxisStyle.IsVisible = true;
myPlot.Grid.YAxisStyle.IsVisible = false;

myPlot.SavePng("demo.png", 400, 300);
最小目盛り間隔
最小目盛り間隔
目盛り間のスペースは、目盛りラベル間の最小距離(ピクセル単位)を示す値を設定することで広げられます。
ScottPlot.Plot myPlot = new();

myPlot.Add.Signal(Generate.Sin(51));
myPlot.Add.Signal(Generate.Cos(51));

ScottPlot.TickGenerators.NumericAutomatic tickGenX = new();
tickGenX.MinimumTickSpacing = 50;
myPlot.Axes.Bottom.TickGenerator = tickGenX;

ScottPlot.TickGenerators.NumericAutomatic tickGenY = new();
tickGenY.MinimumTickSpacing = 25;
myPlot.Axes.Left.TickGenerator = tickGenY;

myPlot.SavePng("demo.png", 400, 300);
目盛りの密度
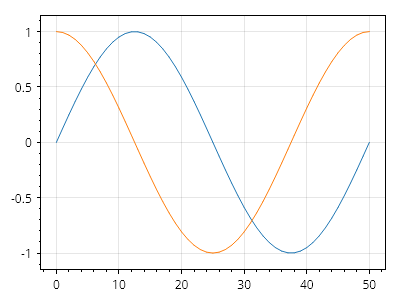
目盛りの密度
目盛りの密度は、デフォルト値に対する割合として調整できます。MinimumTickSpacing とは異なり、この戦略は目盛りラベルのサイズを認識し、それに応じて調整します。
ScottPlot.Plot myPlot = new();

myPlot.Add.Signal(Generate.Sin(51));
myPlot.Add.Signal(Generate.Cos(51));

ScottPlot.TickGenerators.NumericAutomatic tickGenX = new();
tickGenX.TickDensity = 0.2;
myPlot.Axes.Bottom.TickGenerator = tickGenX;

ScottPlot.TickGenerators.NumericAutomatic tickGenY = new();
tickGenY.TickDensity = 0.2;
myPlot.Axes.Left.TickGenerator = tickGenY;

myPlot.SavePng("demo.png", 400, 300);
目盛り数
目盛り数
目標とする目盛りの数を指定でき、自動目盛りジェネレーターはその数の目盛りを配置しようとします。この方式により、画像サイズが大きくなるにつれて目盛りの密度を下げることができます。

ScottPlot.Plot myPlot = new();

myPlot.Add.Signal(Generate.Sin(51));
myPlot.Add.Signal(Generate.Cos(51));

ScottPlot.TickGenerators.NumericAutomatic tickGenX = new();
tickGenX.TargetTickCount = 3;
myPlot.Axes.Bottom.TickGenerator = tickGenX;

ScottPlot.TickGenerators.NumericAutomatic tickGenY = new();
tickGenY.TargetTickCount = 3;
myPlot.Axes.Left.TickGenerator = tickGenY;

myPlot.SavePng("demo.png", 400, 300);
補助目盛の密度
補助目盛の密度
補助目盛マークは、主目盛マークの間隔内に自動的に生成されます。デフォルトでは等間隔ですが、その密度はカスタマイズできます。
ScottPlot.Plot myPlot = new();

// サンプルデータをプロットする
double[] xs = Generate.Consecutive(100);
double[] ys = Generate.NoisyExponential(100);
var sp = myPlot.Add.Scatter(xs, ys);
sp.LineWidth = 0;

// 主目盛ごとに 10 個の補助目盛を持つ補助目盛ジェネレーターを作成する
ScottPlot.TickGenerators.EvenlySpacedMinorTickGenerator minorTickGen = new(10);

// カスタム補助目盛ジェネレーターを使用する数値目盛ジェネレーターを作成する
ScottPlot.TickGenerators.NumericAutomatic tickGen = new();
tickGen.MinorTickGenerator = minorTickGen;

// 左軸にカスタム目盛ジェネレーターを使用するよう指示する
myPlot.Axes.Left.TickGenerator = tickGen;

myPlot.SavePng("demo.png", 400, 300);
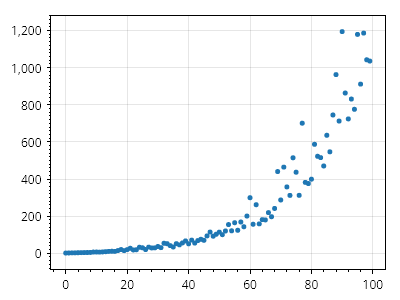
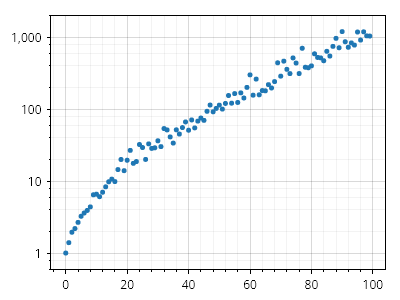
対数スケールの目盛り
対数スケールの目盛り
対数スケーリングの表示は、表示するデータを対数スケール化し、補助目盛りとグリッドをカスタマイズすることで実現できます。
ScottPlot.Plot myPlot = new();

// 元のデータから開始する
double[] xs = Generate.Consecutive(100);
double[] ys = Generate.NoisyExponential(100);

// データを対数スケール化し、負の値を考慮する
double[] logYs = ys.Select(Math.Log10).ToArray();

// 対数スケール化したデータをプロットに追加する
myPlot.Add.ScatterPoints(xs, logYs);

// 対数分布の補助目盛りを配置する補助目盛りジェネレーターを作成する
ScottPlot.TickGenerators.LogMinorTickGenerator minorTickGen = new();

// カスタム補助目盛りジェネレーターを使用する数値目盛りジェネレーターを作成する
ScottPlot.TickGenerators.NumericAutomatic tickGen = new();
tickGen.MinorTickGenerator = minorTickGen;

// 各目盛りのラベルテキストを設定するカスタム目盛りフォーマッターを作成する
static string LogTickLabelFormatter(double y) => $"{Math.Pow(10, y):N0}";

// 主目盛りジェネレーターに、整数の主目盛りのみを表示するよう指示する
tickGen.IntegerTicksOnly = true;

// カスタム目盛りジェネレーターに、新しいラベルフォーマッターを使用するよう指示する
tickGen.LabelFormatter = LogTickLabelFormatter;

// 左軸に、カスタム目盛りジェネレーターを使用するよう指示する
myPlot.Axes.Left.TickGenerator = tickGen;

// 補助目盛りのグリッド線を表示する
myPlot.Grid.MajorLineColor = Colors.Black.WithOpacity(.15);
myPlot.Grid.MinorLineColor = Colors.Black.WithOpacity(.05);
myPlot.Grid.MinorLineWidth = 1;

myPlot.SavePng("demo.png", 400, 300);
カスタム目盛りマーク付きの対数スケール
カスタム目盛りマーク付きの対数スケール
対数軸を持つプロットにおける副目盛りマークの配置は、カスタム副目盛りジェネレーターを使用してカスタマイズできます。ここに示すように、一部は ScottPlot に同梱されている場合がありますが、ユーザーが独自に作成し、ここに示すように適用することもできます。

ScottPlot.Plot myPlot = new();

double[] xs = Generate.Consecutive(100);
double[] logYs = Generate.NoisyExponential(100).Select(Math.Log10).ToArray();
var sp = myPlot.Add.ScatterPoints(xs, logYs);

// この目盛りジェネレーターは、主要な対数目盛りの間に10個の目盛り(10進分布)を配置します
IMinorTickGenerator minorTickGen = new ScottPlot.TickGenerators.LogDecadeMinorTickGenerator();

// カスタム副目盛りジェネレーターを使用する数値目盛りジェネレーターを作成します
ScottPlot.TickGenerators.NumericAutomatic tickGen = new()
{
    MinorTickGenerator = minorTickGen,
    IntegerTicksOnly = true,
    LabelFormatter = (double y) => $"{Math.Pow(10, y):N0}",
};

// 左軸にカスタム目盛りジェネレーターを使用するよう指示し、目盛りを表示するようグリッドを設定します
myPlot.Axes.Left.TickGenerator = tickGen;
myPlot.Grid.MajorLineColor = Colors.Black.WithOpacity(.15);
myPlot.Grid.MinorLineColor = Colors.Black.WithOpacity(.05);
myPlot.Grid.MinorLineWidth = 1;

myPlot.SavePng("demo.png", 400, 300);
その他
Miscellaneous features and customization options
レシピ
データ領域の背景画像
データ領域の背景画像
データ領域の背景に画像を使用できます。
ScottPlot.Plot myPlot = new();

// サンプルデータをプロットする
var sig1 = myPlot.Add.Signal(Generate.Sin());
var sig2 = myPlot.Add.Signal(Generate.Cos());
sig1.LineWidth = 3;
sig2.LineWidth = 3;

// ファイルから画像を読み込むこともできます...
// Image bgImage = new("background.png");

// ただし、この例ではサンプル画像を使用します:
Image bgImage = SampleImages.ScottPlotLogo();
myPlot.DataBackground.Image = bgImage;

myPlot.SavePng("demo.png", 400, 300);
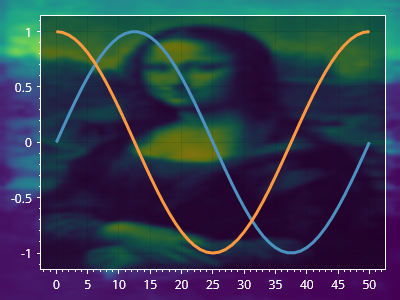
図の背景画像
図の背景画像
画像は図の背景に使用できます。
ScottPlot.Plot myPlot = new();

// サンプルデータをプロットする
var sig1 = myPlot.Add.Signal(Generate.Sin());
var sig2 = myPlot.Add.Signal(Generate.Cos());

// ファイルから画像を読み込むこともできます...
// Image bgImage = new("background.png");

// しかし、この例ではサンプル画像を使用します:
Image bgImage = SampleImages.MonaLisa();
myPlot.FigureBackground.Image = bgImage;

// 軸とデータに色を付け、暗い背景に対して目立たせる
myPlot.Axes.Color(Colors.White);
sig1.Color = sig1.Color.Lighten(.2);
sig2.Color = sig2.Color.Lighten(.2);
sig1.LineWidth = 3;
sig2.LineWidth = 3;

// データ領域に影を付けて目立たせる
myPlot.DataBackground.Color = Colors.Black.WithAlpha(.5);

myPlot.SavePng("demo.png", 400, 300);
カラー補間
カラー補間
色を混ぜ合わせて、さまざまな色を作成できます。この方法では、線形 RGB 補間を使用します。
ScottPlot.Plot myPlot = new();

for (int i = 0; i <= 10; i++)
{
    double fraction = (double)i / 10;
    double x = i;
    double y = Math.Sin(Math.PI *2* fraction);
    var circle = myPlot.Add.Circle(x, y, 2);
    circle.FillColor = Colors.Blue.MixedWith(Colors.Green, fraction);
    circle.LineColor = Colors.Black.WithAlpha(.5);
}

myPlot.SavePng("demo.png", 400, 300);
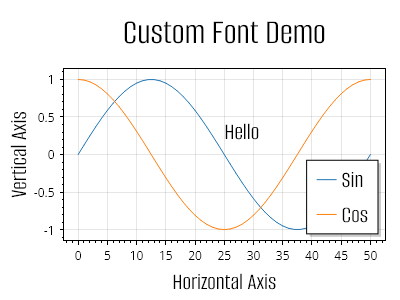
カスタムフォントファイル
カスタムフォントファイル
ユーザーは、フォントファイルから読み込んだカスタム書体を適用できます。
ScottPlot.Plot myPlot = new();

// 指定した名前のフォントでその書体を使用するためにフォントファイルを追加します
Fonts.AddFontFile(
    name: "Alumni Sans",
    path: Path.Combine(Paths.FontFolder, @"AlumniSans/AlumniSans-Regular.ttf"));

// サンプルデータをプロットします
var sig1 = myPlot.Add.Signal(Generate.Sin(51));
sig1.LegendText = "Sin";
var sig2 = myPlot.Add.Signal(Generate.Cos(51));
sig2.LegendText = "Cos";

// カスタムフォントは凡例で使用できます
myPlot.Legend.FontName = "Alumni Sans";
myPlot.Legend.FontSize = 24;

// カスタムフォントは、テキストを含むプロット可能オブジェクトで使用できます
var text = myPlot.Add.Text("こんにちは", 25, 0.5);
text.LabelStyle.FontName = "Alumni Sans";
text.LabelStyle.FontSize = 24;

// カスタムフォントは軸ラベルで使用できます。
// 太字は無効化されていることに注意してください。
// 太字をサポートするには、追加のフォントファイルを読み込む必要があります。
myPlot.Title("カスタムフォントのデモ");
myPlot.Axes.Title.Label.FontName = "Alumni Sans";
myPlot.Axes.Title.Label.FontSize = 36;
myPlot.Axes.Title.Label.Bold = false;

myPlot.XLabel("水平軸");
myPlot.Axes.Bottom.Label.FontName = "Alumni Sans";
myPlot.Axes.Bottom.Label.FontSize = 24;
myPlot.Axes.Bottom.Label.Bold = false;

myPlot.YLabel("垂直軸");
myPlot.Axes.Left.Label.FontName = "Alumni Sans";
myPlot.Axes.Left.Label.FontSize = 24;
myPlot.Axes.Left.Label.Bold = false;

myPlot.SavePng("demo.png", 400, 300);
複数の軸
Tick mark customization and creation of multi-Axis plots
レシピ
右軸
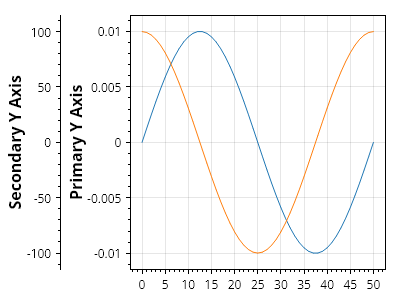
右軸
新しいプロットには、各辺に 1 つずつ軸があります。右側と上側の軸はデフォルトでは非表示です。右軸を使用するには、それを表示してから、プロット可能オブジェクトにそれを使用するよう指示します。
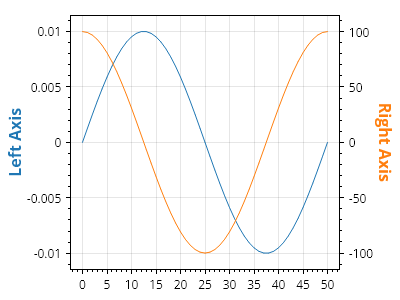
ScottPlot.Plot myPlot = new();

// 非常に異なるスケールのデータをプロットする
var sig1 = myPlot.Add.Signal(Generate.Sin(mult: 0.01));
var sig2 = myPlot.Add.Signal(Generate.Cos(mult: 100));

// 各シグナルプロットに異なる軸を使用するよう指示する
sig1.Axes.YAxis = myPlot.Axes.Left;
sig2.Axes.YAxis = myPlot.Axes.Right;

// 各軸に追加のスタイルオプションを追加する
myPlot.Axes.Left.Label.Text = "左軸";
myPlot.Axes.Right.Label.Text = "右軸";
myPlot.Axes.Left.Label.ForeColor = sig1.Color;
myPlot.Axes.Right.Label.ForeColor = sig2.Color;

myPlot.SavePng("demo.png", 400, 300);
複数軸
複数軸
追加の軸をプロットに追加できます。プロット対象はデフォルトで主軸の座標系を使用して表示されますが、任意のプロット対象を任意の X 軸および Y 軸を使用して表示できます。
ScottPlot.Plot myPlot = new();

// プロット対象はデフォルトで標準の X 軸と Y 軸を使用します
var sig1 = myPlot.Add.Signal(Generate.Sin(51, mult: 0.01));
sig1.Axes.XAxis = myPlot.Axes.Bottom; // 標準の X 軸
sig1.Axes.YAxis = myPlot.Axes.Left; // 標準の Y 軸
myPlot.Axes.Left.Label.Text = "主 Y 軸";

// 2 番目の軸を作成し、プロットに追加します
var yAxis2 = myPlot.Axes.AddLeftAxis();

// 新しいプロット対象を追加し、カスタム Y 軸を使用するように指示します
var sig2 = myPlot.Add.Signal(Generate.Cos(51, mult: 100));
sig2.Axes.XAxis = myPlot.Axes.Bottom; // 標準の X 軸
sig2.Axes.YAxis = yAxis2; // カスタム Y 軸
yAxis2.LabelText = "副 Y 軸";

myPlot.SavePng("demo.png", 400, 300);
右軸のみ
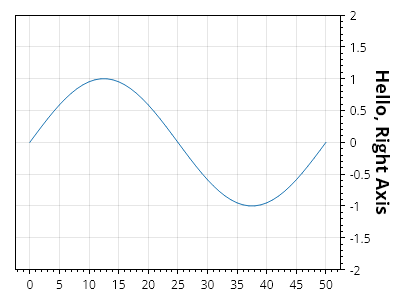
右軸のみ
デフォルトの Y 軸はプロットの左側にある軸ですが、代わりに右側の Y 軸を使用することもできます。
ScottPlot.Plot myPlot = new();

// プロットにプロット可能オブジェクトを追加する
var sig = myPlot.Add.Signal(Generate.Sin());

// プロット可能オブジェクトが右側の Y 軸を使用するように設定する
sig.Axes.YAxis = myPlot.Axes.Right;

// 右側の Y 軸の目盛りを表示するようにグリッドを設定する
myPlot.Grid.YAxis = myPlot.Axes.Right;

// 必要に応じて右軸のスタイルを設定する
myPlot.Axes.Right.Label.Text = "こんにちは、右軸";
myPlot.Axes.Right.Label.FontSize = 18;

// 使用しない軸から目盛りジェネレーターを削除することを推奨します
myPlot.Axes.Left.RemoveTickGenerator();

// SetLimits() を呼び出すときにカスタム軸を渡す
myPlot.Axes.SetLimitsY(bottom: -2, top: 2, yAxis: myPlot.Axes.Right);

myPlot.SavePng("demo.png", 400, 300);
色
Color tools and features built into ScottPlot
レシピ
色のクイックスタート
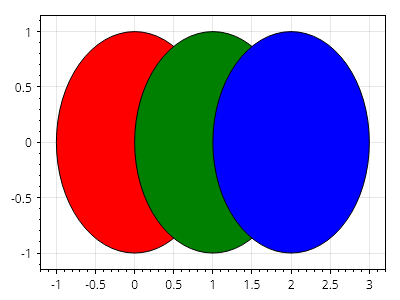
色のクイックスタート
ScottPlot.Colors には多くの色が含まれています
ScottPlot.Plot myPlot = new();

var circle1 = myPlot.Add.Circle(0, 0, 1);
var circle2 = myPlot.Add.Circle(1, 0, 1);
var circle3 = myPlot.Add.Circle(2, 0, 1);

circle1.FillColor = Colors.Red;
circle2.FillColor = Colors.Green;
circle3.FillColor = Colors.Blue;

// プロット上のすべての円の輪郭スタイルを設定する
foreach (var circle in myPlot.GetPlottables<ScottPlot.Plottables.Ellipse>())
    circle.LineColor = Colors.Black;

myPlot.SavePng("demo.png", 400, 300);
色の作成
色の作成
ScottPlot.Colors は、RGB 値 (0-255)、HTML スタイルの 16 進カラーコード (00-FF)、または System.Drawing.Color オブジェクトから構築できます。

ScottPlot.Plot myPlot = new();

var circle1 = myPlot.Add.Circle(0, 0, 1);
var circle2 = myPlot.Add.Circle(1, 0, 1);
var circle3 = myPlot.Add.Circle(2, 0, 1);

circle1.FillColor = new Color(red: 255, green: 0, blue: 0);
circle2.FillColor = new Color(System.Drawing.Color.Green);
circle3.FillColor = new Color("#0000FF");

// プロット上のすべての円の輪郭スタイルを設定する
foreach (var circle in myPlot.GetPlottables<ScottPlot.Plottables.Ellipse>())
    circle.LineColor = Colors.Black;

myPlot.SavePng("demo.png", 400, 300);
アルファチャンネル
アルファチャンネル
アルファチャンネルは色の透明度を設定します
![]()
ScottPlot.Plot myPlot = new();

var circle1 = myPlot.Add.Circle(0, 0, 1);
var circle2 = myPlot.Add.Circle(1, 0, 1);
var circle3 = myPlot.Add.Circle(2, 0, 1);
var circle4 = myPlot.Add.Circle(3, 0, 1);

circle1.FillColor = new Color(red: 255, green: 0, blue: 0, alpha: 128);
circle2.FillColor = Colors.Green.WithAlpha(.5);
circle3.FillColor = Colors.Blue.WithAlpha(.5);
circle4.FillColor = Colors.Magenta.WithOpacity(Colors.Magenta.WithOpacity(0.9).Opacity / 2);

// プロット上のすべての円のアウトラインスタイルを設定する
foreach (var circle in myPlot.GetPlottables<ScottPlot.Plottables.Ellipse>())
    circle.LineColor = Colors.Black;

myPlot.SavePng("demo.png", 400, 300);
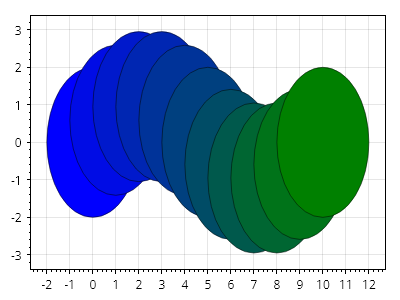
色の混合
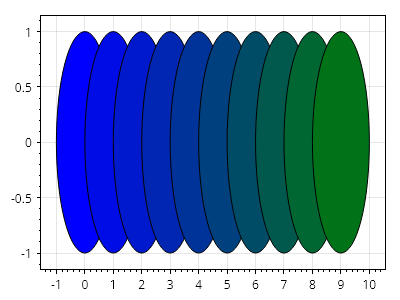
色の混合
Color には、2 つの色をブレンドするために使用できる MixWith() メソッドがあります
ScottPlot.Plot myPlot = new();

Color color1 = Colors.Blue;
Color color2 = Colors.Green;

for (int i = 0; i < 10; i++)
{
    var circle = myPlot.Add.Circle(i, 0, 1);
    double fraction = (double)i / 10;
    circle.FillColor = color1.MixedWith(color2, fraction);
    circle.LineColor = Colors.Black;
}

myPlot.SavePng("demo.png", 400, 300);
Color HSL
Color HSL
色は HSL(色相、彩度、輝度)値から生成できます。
ScottPlot.Plot myPlot = new();

for (int i = 0; i < 10; i++)
{
    var circle = myPlot.Add.Circle(i, 0, 1);
    float fraction = (float)i / 10;
    circle.FillColor = Color.FromHSL(hue: fraction, saturation: 1, luminosity: .5f);
    circle.LineColor = Colors.Black;
}

myPlot.SavePng("demo.png", 400, 300);
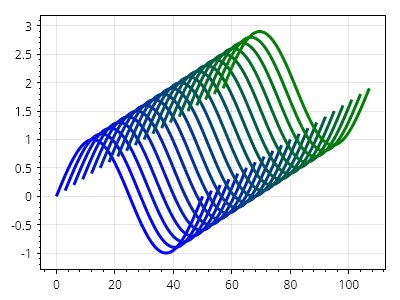
色の補間
色の補間
2つの色の間の線形補間から、色のコレクションを生成できます。
ScottPlot.Plot myPlot = new();

Color[] colors = Color.InterpolateRgbArray(Colors.Blue, Colors.Green, steps: 20);

for (int i = 0; i < colors.Length; i++)
{
    var sig = myPlot.Add.Signal(Generate.Sin());
    sig.Data.XOffset = i *3;
    sig.Data.YOffset = i* .1;
    sig.LineWidth = 3;
    sig.LineColor = colors[i];
}

myPlot.SavePng("demo.png", 400, 300);
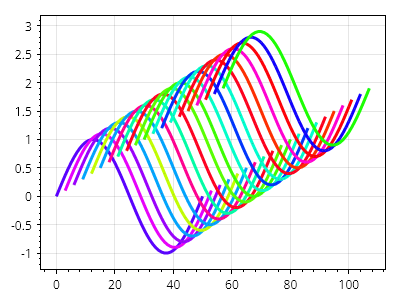
ランダムな色
ランダムな色
ランダムな色を生成する最も簡単な方法は、彩度と明度が同じで、色相だけがランダムな色を作成することです。
ScottPlot.Plot myPlot = new();

for (int i = 0; i < 20; i++)
{
    var sig = myPlot.Add.Signal(Generate.Sin());
    sig.Data.XOffset = i *3;
    sig.Data.YOffset = i* .1;
    sig.LineWidth = 3;
    sig.LineColor = Color.RandomHue();
}

myPlot.SavePng("demo.png", 400, 300);
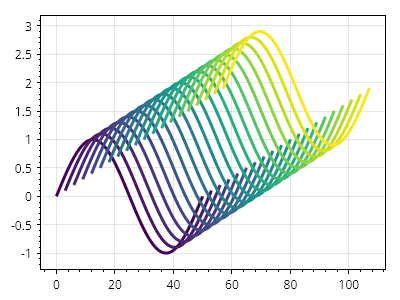
カラーマップからの色
カラーマップからの色
カラーマップを使用して、色のコレクションを取得できます。
ScottPlot.Plot myPlot = new();

IColormap colormap = new ScottPlot.Colormaps.Viridis();
Color[] colors = colormap.GetColors(20);

for (int i = 0; i < colors.Length; i++)
{
    var sig = myPlot.Add.Signal(Generate.Sin());
    sig.Data.XOffset = i *3;
    sig.Data.YOffset = i* .1;
    sig.LineWidth = 3;
    sig.LineColor = colors[i];
}

myPlot.SavePng("demo.png", 400, 300);
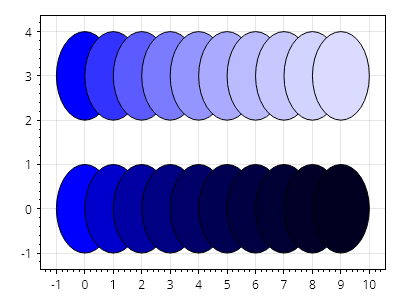
色を明るくする、暗くする
色を明るくする、暗くする
ヘルパーメソッドにより、色を簡単に明るくしたり暗くしたりできます。
ScottPlot.Plot myPlot = new();

Color color1 = Colors.Blue;
Color color2 = Colors.Blue;

for (int i = 0; i < 10; i++)
{
    var circle1 = myPlot.Add.Circle(i, 3, 1);
    var circle2 = myPlot.Add.Circle(i, 0, 1);
    circle1.FillColor = color1;
    circle2.FillColor = color2;
    color1 = color1.Lighten(.2);
    color2 = color2.Darken(.2);
}

// プロット上のすべての円のアウトラインスタイルを設定する
foreach (var circle in myPlot.GetPlottables<ScottPlot.Plottables.Ellipse>())
    circle.LineColor = Colors.Black;

myPlot.SavePng("demo.png", 400, 300);
プロット可能オブジェクトの管理
How to add, remove, and reorder items in plots
レシピ
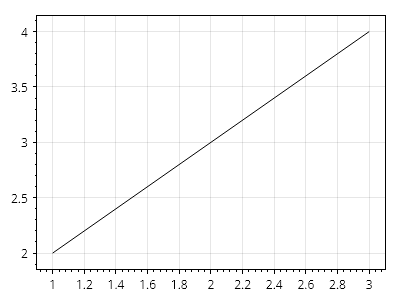
Plottable を手動で追加する
Plottable を手動で追加する
Plot.Add クラスには、plottable オブジェクトを作成してプロットに追加するための便利なメソッドが多数ありますが、ユーザーは plottable オブジェクトを自分でインスタンス化し、Add.Plottable() を使用してそれをプロット上に配置できます。この方法により、ユーザーはカスタムの外観や動作を持つ独自の plottable(IPlottable を実装)を作成できます。
ScottPlot.Plot myPlot = new();

// plottable を作成し、必要に応じて変更する
ScottPlot.Plottables.LinePlot line = new()
{
    Start = new Coordinates(1, 2),
    End = new Coordinates(3, 4),
};

// カスタム plottable をプロットに追加する
myPlot.Add.Plottable(line);

myPlot.SavePng("demo.png", 400, 300);
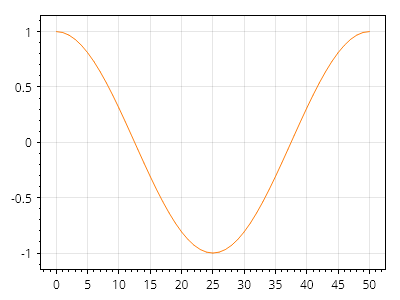
プロットのクリア
プロットのクリア
すべての plottable を削除するには Clear() を使用します。
![]()
ScottPlot.Plot myPlot = new();

// plottable を追加する
myPlot.Add.Signal(Generate.Sin());
myPlot.Add.Signal(Generate.Cos());

// すべての plottable を削除する
myPlot.Clear();

myPlot.SavePng("demo.png", 400, 300);
Plottable の削除
Plottable の削除
個々の項目をプロットから削除できます。
ScottPlot.Plot myPlot = new();

// plottable を追加する
var sig1 = myPlot.Add.Signal(Generate.Sin());
var sig2 = myPlot.Add.Signal(Generate.Cos());

// 特定の plottable を削除する
myPlot.Remove(sig1);

myPlot.SavePng("demo.png", 400, 300);
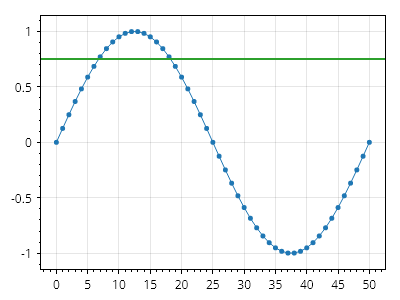
ある型のすべての Plottable を削除する
ある型のすべての Plottable を削除する
指定した型のすべての plottable は、1つのコマンドでプロットから削除できます。
ScottPlot.Plot myPlot = new();

myPlot.Add.Scatter(Generate.Consecutive(51), Generate.Sin(51));
myPlot.Add.Signal(Generate.Cos());
myPlot.Add.HorizontalLine(0.75);

// 特定の plottable 型のすべてのインスタンスを削除する
myPlot.Remove<ScottPlot.Plottables.Signal>();

myPlot.SavePng("demo.png", 400, 300);
プロット可能オブジェクトの移動
プロット可能オブジェクトの移動
プロット可能オブジェクトのリストには、順番にレンダリングされるすべてのプロット可能オブジェクトが含まれます。プロット可能オブジェクトを前面に移動するためのヘルパーメソッドが用意されています。
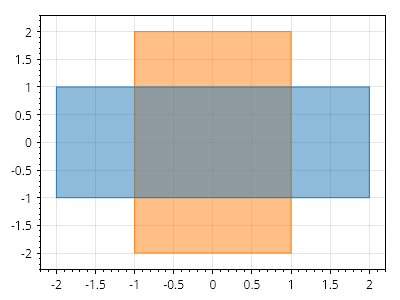
ScottPlot.Plot myPlot = new();

CoordinateRect wideRect = new(-2, 2, -1, 1);
CoordinateRect tallRect = new(-1, 1, -2, 2);

// rect1 が最初に追加されるため、後から追加されたプロット可能オブジェクトは上に表示されます
var rect1 = myPlot.Add.Rectangle(wideRect);
var rect2 = myPlot.Add.Rectangle(tallRect);

// プロット可能オブジェクトは、常に上に表示されるように前面へ移動できます
myPlot.MoveToTop(rect1);

myPlot.SavePng("demo.png", 400, 300);
軸と目盛り
Examples of common customizations for axis labels and ticks
レシピ
- 軸の範囲を設定する
- 軸の範囲を読み取る
- データに合わせて軸の範囲を自動スケールする
- 反転軸
- 反転した自動軸
- 正方形の軸単位
- サブタイトル付きの軸
- 軸のアンチエイリアス
- 軸を非表示にし、フレーム線のオン/オフを切り替える
- DateTime 軸クイックスタート
- DateTime 軸の値
- カスタム DateTime ラベル形式
- DateTime 軸の固定間隔目盛り
- 浮動軸
- グリッド線のスタイル
- 画像の軸ラベル
- 乗数表記
軸の範囲を設定する
軸の範囲を設定する
軸の範囲はユーザーが設定できます。
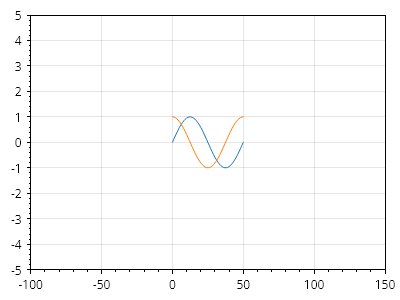
ScottPlot.Plot myPlot = new();

myPlot.Add.Signal(Generate.Sin(51));
myPlot.Add.Signal(Generate.Cos(51));

myPlot.Axes.SetLimits(-100, 150, -5, 5);

myPlot.SavePng("demo.png", 400, 300);
軸の範囲を読み取る
軸の範囲を読み取る
現在の軸の範囲を取得するには GetLimits() を使用します。

ScottPlot.Plot myPlot = new();

myPlot.Add.Signal(Generate.Sin(51));
myPlot.Add.Signal(Generate.Cos(51));

AxisLimits limits = myPlot.Axes.GetLimits();
double xMin = limits.Left;
double xMax = limits.Right;
double yMin = limits.Bottom;
double yMax = limits.Top;

myPlot.SavePng("demo.png", 400, 300);
データに合わせて軸の範囲を自動スケールする
データに合わせて軸の範囲を自動スケールする
軸の範囲は、データに合うように自動的に調整できます。オプション引数により、ユーザーはデータの端の周囲にある余白の量を定義できます。ScottPlot の古いバージョンでは、この機能は AxisAuto() という名前のメソッドによって実現されていました。

ScottPlot.Plot myPlot = new();

myPlot.Add.Signal(Generate.Sin(51));
myPlot.Add.Signal(Generate.Cos(51));

// データに合わない範囲を設定する
myPlot.Axes.SetLimits(-100, 150, -5, 5);

// データに合うように範囲をリセットする
myPlot.Axes.AutoScale();

myPlot.SavePng("demo.png", 400, 300);
反転軸
反転軸
ユーザーは、軸の下限を上限よりも正の値に設定して軸の範囲を設定することで、反転軸上にデータを表示できます。
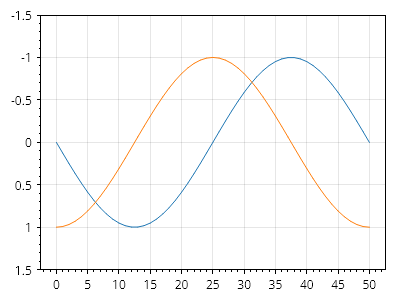
ScottPlot.Plot myPlot = new();

myPlot.Add.Signal(Generate.Sin());
myPlot.Add.Signal(Generate.Cos());

myPlot.Axes.SetLimitsY(bottom: 1.5, top: -1.5);

myPlot.SavePng("demo.png", 400, 300);
反転した自動軸
反転した自動軸
自動軸スケーラーのロジックをカスタマイズして、特定の軸の軸範囲が自動スケーリング時に常に反転されるようにします。
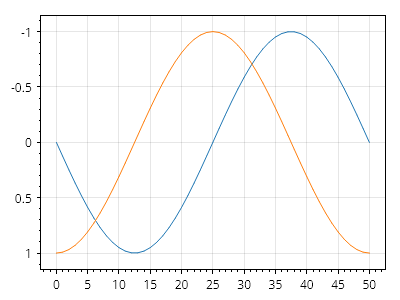
ScottPlot.Plot myPlot = new();

myPlot.Add.Signal(Generate.Sin());
myPlot.Add.Signal(Generate.Cos());

myPlot.Axes.AutoScaler.InvertedY = true;

myPlot.SavePng("demo.png", 400, 300);
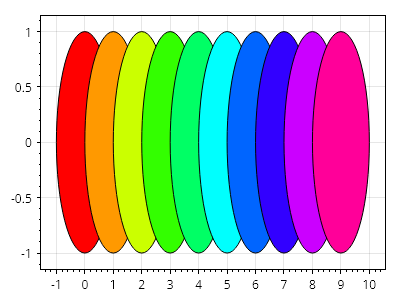
正方形の軸単位
正方形の軸単位
垂直方向のスケール(ピクセルあたりの単位数)が水平方向のスケールと一致するように強制する軸ルールを設定できます。これにより、円は常に円として表示され、引き伸ばされた楕円にはなりません。
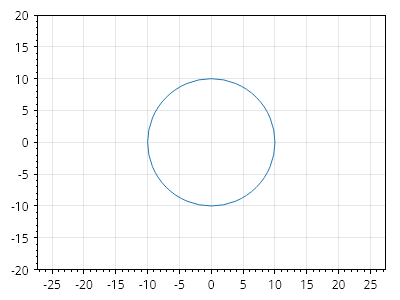
ScottPlot.Plot myPlot = new();

myPlot.Add.Circle(0, 0, 10);

// ピクセルのスケール比を 1:1 に強制する
myPlot.Axes.SquareUnits();

// 軸を「引き伸ばそう」としても、軸の範囲は自動的に調整される
myPlot.Axes.SetLimits(-10, 10, -20, 20);

myPlot.SavePng("demo.png", 400, 300);
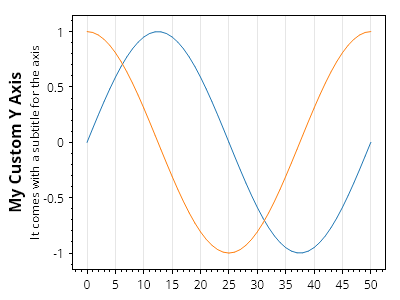
サブタイトル付きの軸
サブタイトル付きの軸
ユーザーは、デフォルトの軸を置き換えるために、完全にカスタムされた独自の軸を作成できます(デモアプリで示されているとおり)。代替の軸表示スタイルに関心のあるユーザー向けに、いくつかの実験的な軸が利用可能です。
ScottPlot.Plot myPlot = new();

// サンプルデータをプロットする
myPlot.Add.Signal(Generate.Sin());
myPlot.Add.Signal(Generate.Cos());

// カスタム軸をインスタンス化し、必要に応じてカスタマイズする
ScottPlot.AxisPanels.Experimental.LeftAxisWithSubtitle customAxisY = new()
{
    LabelText = "My Custom Y Axis",
    SubLabelText = "It comes with a subtitle for the axis"
};

// デフォルトのY軸を削除し、カスタム軸をプロットに追加する
myPlot.Axes.Remove(myPlot.Axes.Left);
myPlot.Axes.AddLeftAxis(customAxisY);

myPlot.SavePng("demo.png", 400, 300);
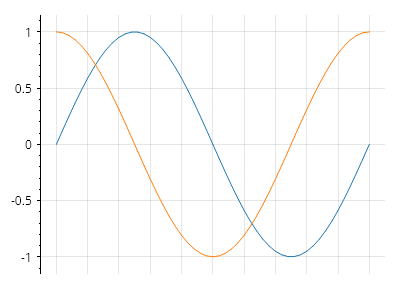
軸のアンチエイリアス
軸のアンチエイリアス
垂直および水平の直線の鮮明さを向上させるため、軸フレーム、目盛り、グリッド線では、デフォルトでアンチエイリアスが無効になっています。AntiAlias ヘルパーメソッドを呼び出すことで、これらすべてのオブジェクトに対してアンチエイリアスを有効にできます。

ScottPlot.Plot myPlot = new();

double[] dataX = { 1, 2, 3, 4, 5 };
double[] dataY = { 1, 4, 9, 16, 25 };
myPlot.Add.Scatter(dataX, dataY);

myPlot.Axes.AntiAlias(true);

myPlot.SavePng("demo.png", 400, 300);
軸を非表示にし、フレーム線のオン/オフを切り替える
軸を非表示にし、フレーム線のオン/オフを切り替える
軸の目盛りを非表示にし、フレーム線のオン/オフを切り替える方法を示します。
ScottPlot.Plot myPlot = new();

myPlot.Add.Signal(Generate.Sin());
myPlot.Add.Signal(Generate.Cos());

// 軸ラベルと目盛りを非表示にする
myPlot.Axes.Bottom.TickLabelStyle.IsVisible = false;
myPlot.Axes.Bottom.MajorTickStyle.Length = 0;
myPlot.Axes.Bottom.MinorTickStyle.Length = 0;

// 軸の端の線を非表示にする
myPlot.Axes.Bottom.FrameLineStyle.Width = 0;
myPlot.Axes.Right.FrameLineStyle.Width = 0;
myPlot.Axes.Top.FrameLineStyle.Width = 0;

myPlot.SavePng("demo.png", 400, 300);
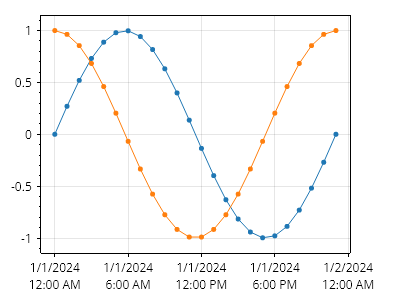
DateTime 軸クイックスタート
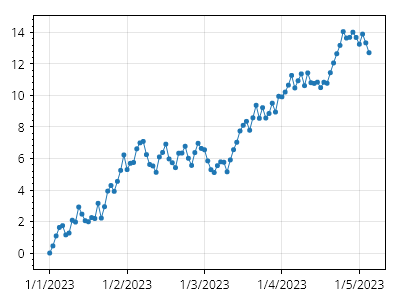
DateTime 軸クイックスタート
軸の目盛りラベルは、時刻形式を使用して表示できます。

ScottPlot.Plot myPlot = new();

// DateTime 単位を使用してデータをプロットする
DateTime[] dates = Generate.ConsecutiveDays(100);
double[] ys = Generate.RandomWalk(100);
myPlot.Add.Scatter(dates, ys);

// 下部の軸に日付を表示するようプロットに指示する
myPlot.Axes.DateTimeTicksBottom();

myPlot.SavePng("demo.png", 400, 300);
DateTime 軸の値
DateTime 軸の値
DateTime 軸は、Microsoft の DateTime.ToOADate() メソッドと DateTime.FromOADate() メソッドを使用して、日付と数値の間で変換することで実現されます。DateTime 軸にデータを表示したい上級ユーザーは、DateTime のコレクションではなく double のコレクションを扱うことを好む場合があります。
ScottPlot.Plot myPlot = new();

// 1 時間間隔の DateTime の配列を作成する
int numberOfHours = 24;
DateTime[] dateTimes = new DateTime[numberOfHours];
DateTime startDateTime = new(2024, 1, 1);
TimeSpan deltaTimeSpan = TimeSpan.FromHours(1);
for (int i = 0; i < numberOfHours; i++)
{
    dateTimes[i] = startDateTime + i * deltaTimeSpan;
}

// 同じ DateTime を 1 時間間隔で表す double の配列を作成する
double[] dateDoubles = new double[numberOfHours];
double startDouble = startDateTime.ToOADate(); // 1900 年からの日数
double deltaDouble = 1.0 / 24.0; // 1 時間は 1 日の 1/24
for (int i = 0; i < numberOfHours; i++)
{
    dateDoubles[i] = startDouble + i * deltaDouble;
}

// これで両方の配列が同じ日付を表す
myPlot.Add.Scatter(dateTimes, Generate.Sin(numberOfHours));
myPlot.Add.Scatter(dateDoubles, Generate.Cos(numberOfHours));
myPlot.Axes.DateTimeTicksBottom();

// 幅の広い目盛りラベル用のスペースを確保するため、右側にパディングを追加する
myPlot.Axes.Right.MinimumSize = 50;

myPlot.SavePng("demo.png", 400, 300);
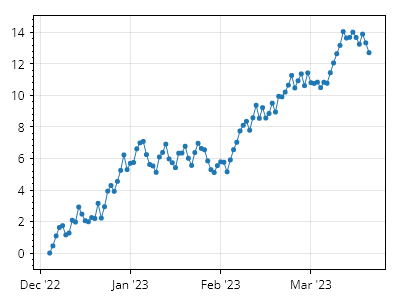
カスタム DateTime ラベル形式
カスタム DateTime ラベル形式
ユーザーは、DateTime の目盛りラベルをカスタマイズするための独自のロジックを提供できます
ScottPlot.Plot myPlot = new();

// サンプルの DateTime データをプロットする
DateTime[] dates = Generate.ConsecutiveDays(100);
double[] ys = Generate.RandomWalk(100);
myPlot.Add.Scatter(dates, ys);
myPlot.Axes.DateTimeTicksBottom();

// RenderStarting イベントにロジックを追加して目盛りラベルをカスタマイズする
myPlot.RenderManager.RenderStarting += (s, e) =>
{
    Tick[] ticks = myPlot.Axes.Bottom.TickGenerator.Ticks;
    for (int i = 0; i < ticks.Length; i++)
    {
        DateTime dt = DateTime.FromOADate(ticks[i].Position);
        string label = $"{dt:MMM} '{dt:yy}";
        ticks[i] = new Tick(ticks[i].Position, label);
    }
};

myPlot.SavePng("demo.png", 400, 300);
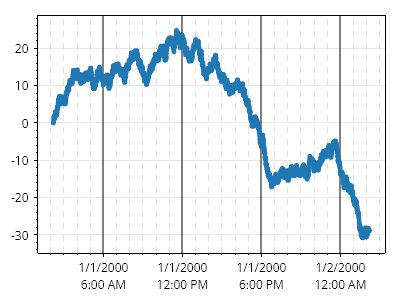
DateTime 軸の固定間隔目盛り
DateTime 軸の固定間隔目盛り
目盛りを固定間隔でレンダリングします。必要に応じて、プロットの開始日時を使用するのではなく、カスタム開始日時から目盛りをレンダリングできます(例: 毎時ちょうどに目盛りを描画する、毎月1日に目盛りを描画する、など)。
ScottPlot.Plot myPlot = new();

// 24時間分のサンプル DateTime データをプロットします(1分ごとに1点)
DateTime[] dates = Generate.ConsecutiveMinutes(24 *60, new DateTime(2000, 1, 1, 2, 12, 0));
double[] ys = Generate.RandomWalk(24* 60);
myPlot.Add.Scatter(dates, ys);
var dtAx = myPlot.Axes.DateTimeTicksBottom();

// 固定間隔の目盛りを作成します。大目盛りは6時間ごと、小目盛りは1時間ごとです
dtAx.TickGenerator = new ScottPlot.TickGenerators.DateTimeFixedInterval(
    new ScottPlot.TickGenerators.TimeUnits.Hour(), 6,
    new ScottPlot.TickGenerators.TimeUnits.Hour(), 1,
    // ここでは、目盛りの開始位置をオーバーライドするデリゲートを指定します。この場合、大目盛りは
    // 00:00、06:00、12:00 などにし、小目盛りは毎時ちょうど、つまり1時間ごとにしたいので、午前0時から開始します。
    // このデリゲートを指定しない場合、目盛りは x 軸の Min が何であれそこから開始されます。
    // 大目盛りが午前1:30、午前7:30 などになる可能性があり、プロットをパンしても目盛り位置は
    // プロット上で固定されます。
    dt => new DateTime(dt.Year, dt.Month, dt.Day));

// 目盛りを見やすくするためにグリッド線をカスタマイズします
myPlot.Grid.XAxisStyle.MajorLineStyle.Color = Colors.Black.WithOpacity();
myPlot.Grid.XAxisStyle.MajorLineStyle.Width = 2;

myPlot.Grid.XAxisStyle.MinorLineStyle.Color = Colors.Gray.WithOpacity(0.25);
myPlot.Grid.XAxisStyle.MinorLineStyle.Width = 1;
myPlot.Grid.XAxisStyle.MinorLineStyle.Pattern = LinePattern.DenselyDashed;

// 小目盛りのラベルを削除します。そうしないと、目盛りラベルが大きく重なります
myPlot.RenderManager.RenderStarting += (s, e) =>
{
    Tick[] ticks = myPlot.Axes.Bottom.TickGenerator.Ticks;
    for (int i = 0; i < ticks.Length; i++)
    {
        if (ticks[i].IsMajor)
        {
            continue;
        }

        ticks[i] = new Tick(ticks[i].Position, "", ticks[i].IsMajor);
    }
};

myPlot.SavePng("demo.png", 400, 300);
浮動軸
浮動軸
浮動軸または中央配置の軸は、プロットの端に表示されるデフォルトの軸を非表示にし、新しい浮動軸を作成してプロットに追加することで実現できます。
ScottPlot.Plot myPlot = new();

// 既存の軸のいずれかを参照として使用して、浮動 X 軸と Y 軸を作成する
ScottPlot.Plottables.FloatingAxis floatingX = new(myPlot.Axes.Bottom);
ScottPlot.Plottables.FloatingAxis floatingY = new(myPlot.Axes.Left);

// デフォルトの軸を非表示にし、カスタム軸をプロットに追加する
myPlot.Axes.Frameless();
myPlot.HideGrid();
myPlot.Add.Plottable(floatingX);
myPlot.Add.Plottable(floatingY);

// サンプルデータを最後に追加して、最前面に表示されるようにする
myPlot.Add.Signal(Generate.Sin(51));
myPlot.Add.Signal(Generate.Cos(51));

myPlot.SavePng("demo.png", 400, 300);
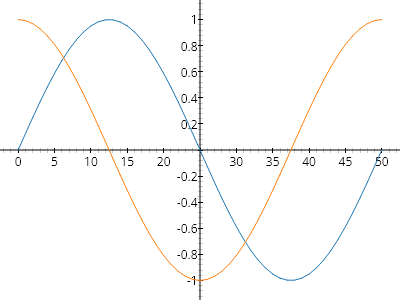
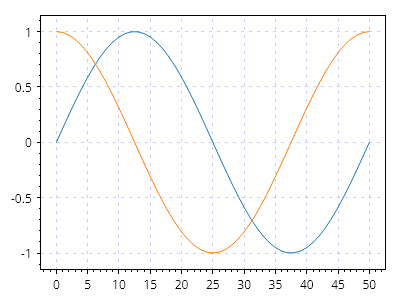
グリッド線のスタイル
グリッド線のスタイル
グリッド線には、広範なカスタマイズを可能にする多くのオプションがあります。
ScottPlot.Plot myPlot = new();

myPlot.Add.Signal(Generate.Sin(51));
myPlot.Add.Signal(Generate.Cos(51));

myPlot.Grid.LineColor = Colors.Blue.WithAlpha(.2);
myPlot.Grid.LinePattern = LinePattern.Dotted;

myPlot.SavePng("demo.png", 400, 300);
画像の軸ラベル
画像の軸ラベル
軸ラベルのフォントスタイル設定では望ましいレベルのカスタマイズができない場合、ビットマップ画像を軸ラベルとして表示できます。この方法により、そのテキストをビットマップとしてレンダリングできる任意のサードパーティツールを使ってリッチテキストを実現できます。また、ユーザーは軸ラベルにアイコンや画像を配置できます。
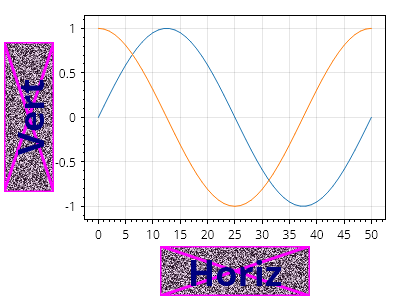
ScottPlot.Plot myPlot = new();

myPlot.Add.Signal(Generate.Sin(51));
myPlot.Add.Signal(Generate.Cos(51));

// この配列はビットマップのバイトを保持します。ここでは生成していますが、
// ディスク上のビットマップファイルから読み取ったバイト配列でもかまいません。
byte[] bytes1 = SampleImages.NoisyText("Horiz", 150, 50).GetImageBytes();
byte[] bytes2 = SampleImages.NoisyText("Vert", 150, 50).GetImageBytes();

// ビットマップのバイトから ScottPlot.Image を作成します
ScottPlot.Image img1 = new(bytes1);
ScottPlot.Image img2 = new(bytes2);

// 下軸ラベル用の画像を表示します
myPlot.Axes.Bottom.Label.Image = img1;
myPlot.Axes.Left.Label.Image = img2;

myPlot.SavePng("demo.png", 400, 300);
乗数表記
乗数表記
数値の目盛りラベルは、乗数表記(目盛りラベルを科学表記で表示し、指数をプロットの隅に表示する形式)を使用して表示できます。単一のステートメントで乗数表記をセットアップできるヘルパーメソッドが用意されていますが、ユーザーはこのメソッドが返すオブジェクトを操作したり(ここでは示していません)、そのメソッド内のコードを調べたりすることで、より高度なカスタマイズ機能を実現する方法を学べます。
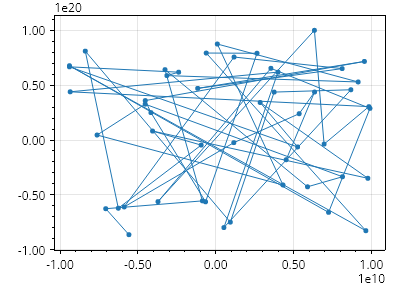
ScottPlot.Plot myPlot = new();

// 非常に大きな値を持つサンプルデータをプロットする
double[] xs = Generate.RandomSample(50, -1e10, 1e10);
double[] ys = Generate.RandomSample(50, -1e20, 1e20);
myPlot.Add.Scatter(xs, ys);

// 両方の主軸で乗数表記を有効にする
myPlot.Axes.SetupMultiplierNotation(myPlot.Axes.Left);
myPlot.Axes.SetupMultiplierNotation(myPlot.Axes.Bottom);

myPlot.SavePng("demo.png", 400, 300);
凡例
A legend is a key typically displayed in the corner of a plot
レシピ
- 凡例クイックスタート
- 右から左(RTL)に書くテキストのサポート
- 手動の凡例項目
- 凡例のカスタマイズ
- 凡例マーカー形状のオーバーライド
- 自動色による凡例マーカー形状のオーバーライド
- 凡例の向き
- 凡例の折り返し
- 複数の凡例
- プロットの外側の凡例
- 自動凡例項目のカスタムフォント
- 手動凡例項目のカスタムフォント
- タイトル付き凡例
凡例クイックスタート
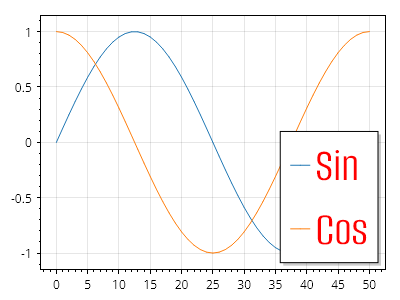
凡例クイックスタート
多くのプロット可能オブジェクトには Label プロパティがあり、これを設定すると凡例に表示されます。
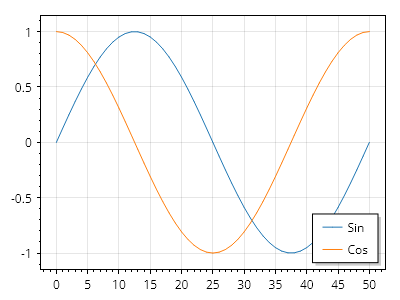
ScottPlot.Plot myPlot = new();

var sig1 = myPlot.Add.Signal(Generate.Sin(51));
sig1.LegendText = "Sin";

var sig2 = myPlot.Add.Signal(Generate.Cos(51));
sig2.LegendText = "Cos";

myPlot.ShowLegend();

myPlot.SavePng("demo.png", 400, 300);
右から左(RTL)に書くテキストのサポート
右から左(RTL)に書くテキストのサポート
右から左(RTL)に書くテキストのサポートを有効にすると、RTL 言語のテキストが正しくレンダリングされます。
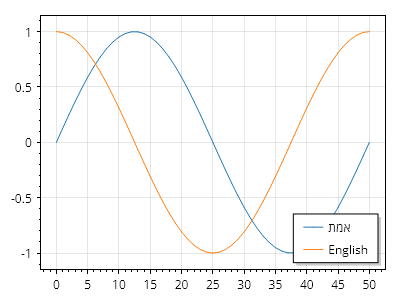
ScottPlot.Plot myPlot = new();

LabelStyle.RTLSupport = true; // 右から左に書くテキストのサポートを有効にする

var sig1 = myPlot.Add.Signal(Generate.Sin(51));
sig1.LegendText = "אמת"; // 右から左に書くテキストの例

var sig2 = myPlot.Add.Signal(Generate.Cos(51));
sig2.LegendText = "英語"; // 左から右に書くテキストの例

myPlot.ShowLegend();

myPlot.SavePng("demo.png", 400, 300);
手動の凡例項目
手動の凡例項目
凡例は手動で構築でき、マーカーをカスタマイズできます。
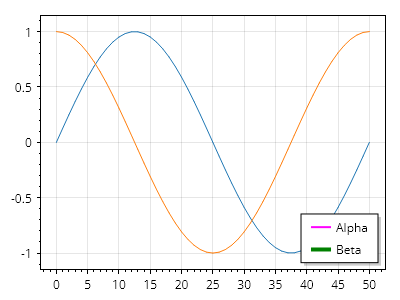
ScottPlot.Plot myPlot = new();

myPlot.Add.Signal(Generate.Sin(51));
myPlot.Add.Signal(Generate.Cos(51));
myPlot.Legend.IsVisible = true;

LegendItem item1 = new()
{
    LineColor = Colors.Magenta,
    MarkerFillColor = Colors.Magenta,
    MarkerLineColor = Colors.Magenta,
    MarkerShape = MarkerShape.Cross,
    LineWidth = 2,
    LabelText = "Alpha"
};

LegendItem item2 = new()
{
    LineColor = Colors.Green,
    MarkerFillColor = Colors.Green,
    MarkerLineColor = Colors.Green,
    LineWidth = 4,
    LabelText = "Beta"
};

LegendItem[] items = { item1, item2 };
myPlot.ShowLegend(items);

myPlot.SavePng("demo.png", 400, 300);
凡例のカスタマイズ
凡例のカスタマイズ
高度なカスタマイズオプションを利用するには、Legend オブジェクトに直接アクセスします。
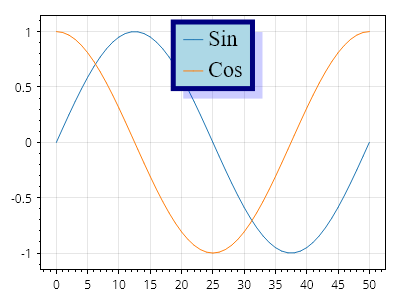
ScottPlot.Plot myPlot = new();

var sig1 = myPlot.Add.Signal(Generate.Sin(51));
sig1.LegendText = "Sin";

var sig2 = myPlot.Add.Signal(Generate.Cos(51));
sig2.LegendText = "Cos";

myPlot.Legend.IsVisible = true;
myPlot.Legend.Alignment = Alignment.UpperCenter;

myPlot.Legend.OutlineColor = Colors.Navy;
myPlot.Legend.OutlineWidth = 5;
myPlot.Legend.BackgroundColor = Colors.LightBlue;

myPlot.Legend.ShadowColor = Colors.Blue.WithOpacity(.2);
myPlot.Legend.ShadowOffset = new(10, 10);

myPlot.Legend.FontSize = 22;
myPlot.Legend.FontName = Fonts.Serif;

myPlot.SavePng("demo.png", 400, 300);
凡例マーカー形状のオーバーライド
凡例マーカー形状のオーバーライド
凡例の形状オーバーライドを使用すると、すべての凡例項目を指定したマーカー形状で強制的に表示できます。
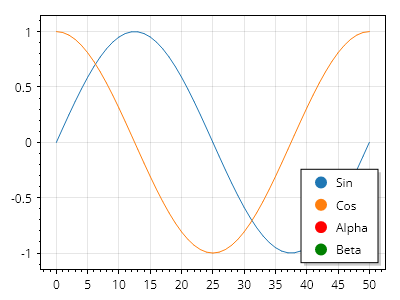
ScottPlot.Plot myPlot = new();

// この形状は、定義済みのマーカーがない凡例項目に使用されます
myPlot.Legend.MarkerShapeOverride = MarkerShape.FilledCircle;

var sig1 = myPlot.Add.Signal(Generate.Sin(51));
sig1.LegendText = "Sin";

var sig2 = myPlot.Add.Signal(Generate.Cos(51));
sig2.LegendText = "Cos";

LegendItem item1 = new()
{
    MarkerColor = Colors.Red,
    MarkerShape = MarkerShape.Cross,
    LabelText = "Alpha"
};

LegendItem item2 = new()
{
    MarkerColor = Colors.Green,
    MarkerShape = MarkerShape.FilledSquare,
    LabelText = "Beta"
};

myPlot.Legend.ManualItems.Add(item1);
myPlot.Legend.ManualItems.Add(item2);

myPlot.ShowLegend();

myPlot.SavePng("demo.png", 400, 300);
自動色による凡例マーカー形状のオーバーライド
自動色による凡例マーカー形状のオーバーライド
凡例の形状オーバーライドを使用して、すべての凡例項目が指定されたマーカー形状で表示されるように強制します。この例では、色は自動的に決定されます。
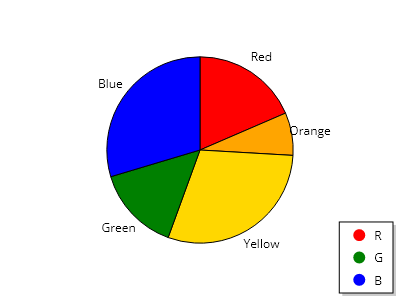
ScottPlot.Plot myPlot = new();

List<PieSlice> slices =
[
    new PieSlice() { Value = 5, FillColor = Colors.Red, Label = "赤", LegendText = "R" },
    new PieSlice() { Value = 2, FillColor = Colors.Orange, Label = "オレンジ" },
    new PieSlice() { Value = 8, FillColor = Colors.Gold, Label = "黄" },
    new PieSlice() { Value = 4, FillColor = Colors.Green, Label = "緑", LegendText = "G" },
    new PieSlice() { Value = 8, FillColor = Colors.Blue, Label = "青", LegendText = "B" },
];

myPlot.Legend.MarkerShapeOverride = MarkerShape.FilledCircle;

var pie = myPlot.Add.Pie(slices);

myPlot.Axes.Frameless();
myPlot.HideGrid();
myPlot.ShowLegend();

myPlot.SavePng("demo.png", 400, 300);
凡例の向き
凡例の向き
凡例項目は、垂直方向ではなく水平方向に配置できます
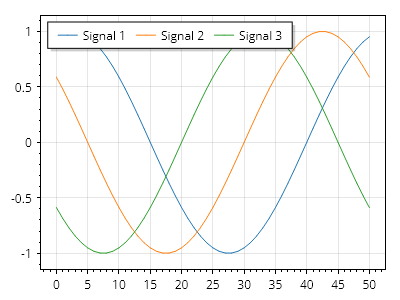
ScottPlot.Plot myPlot = new();

var sig1 = myPlot.Add.Signal(Generate.Sin(51, phase: .2));
var sig2 = myPlot.Add.Signal(Generate.Sin(51, phase: .4));
var sig3 = myPlot.Add.Signal(Generate.Sin(51, phase: .6));

sig1.LegendText = "信号 1";
sig2.LegendText = "信号 2";
sig3.LegendText = "信号 3";

myPlot.ShowLegend(Alignment.UpperLeft, Orientation.Horizontal);

myPlot.SavePng("demo.png", 400, 300);
凡例の折り返し
凡例の折り返し
項目数が多い場合の表示を改善するために、凡例項目は折り返されることがあります
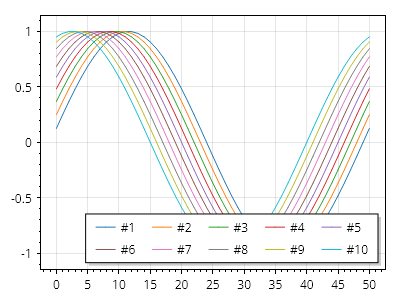
ScottPlot.Plot myPlot = new();

for (int i = 1; i <= 10; i++)
{
    double[] data = Generate.Sin(51, phase: .02 * i);
    var sig = myPlot.Add.Signal(data);
    sig.LegendText = $"#{i}";
}

myPlot.Legend.IsVisible = true;
myPlot.Legend.Orientation = Orientation.Horizontal;

myPlot.SavePng("demo.png", 400, 300);
複数の凡例
複数の凡例
複数の凡例をプロットに追加できます
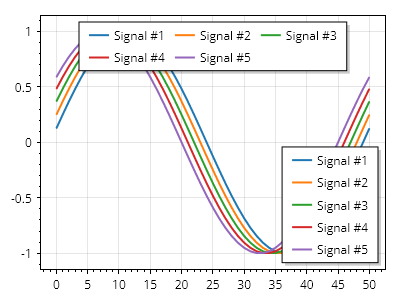
ScottPlot.Plot myPlot = new();

for (int i = 1; i <= 5; i++)
{
    double[] data = Generate.Sin(51, phase: .02 * i);
    var sig = myPlot.Add.Signal(data);
    sig.LegendText = $"Signal #{i}";
    sig.LineWidth = 2;
}

// デフォルトの凡例
var leg1 = myPlot.ShowLegend();
leg1.Alignment = Alignment.LowerRight;
leg1.Orientation = Orientation.Vertical;

// 追加の凡例
var leg2 = myPlot.Add.Legend();
leg2.Alignment = Alignment.UpperCenter;
leg2.Orientation = Orientation.Horizontal;

myPlot.SavePng("demo.png", 400, 300);
プロットの外側の凡例
プロットの外側の凡例
データ領域の外側に凡例を表示するには、Edge を受け取る ShowLegend() オーバーロードを使用します。
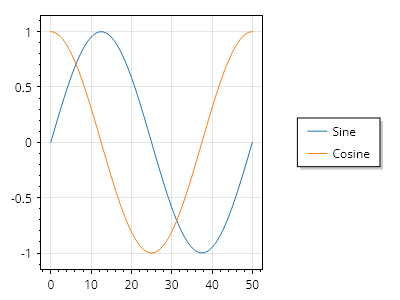
ScottPlot.Plot myPlot = new();

var sig1 = myPlot.Add.Signal(Generate.Sin());
var sig2 = myPlot.Add.Signal(Generate.Cos());

sig1.LegendText = "サイン";
sig2.LegendText = "コサイン";

myPlot.ShowLegend(Edge.Right);

myPlot.SavePng("demo.png", 400, 300);
自動凡例項目のカスタムフォント
自動凡例項目のカスタムフォント
凡例で TTF ファイルのカスタムフォントを使用します。
ScottPlot.Plot myPlot = new();

Fonts.AddFontFile("Alumni Sans", Path.Combine(GetFontsBasePath(), @"AlumniSans/AlumniSans-Regular.ttf"), bold: false, italic: false);

var sig1 = myPlot.Add.Signal(Generate.Sin(51));
sig1.LegendText = "Sin";

var sig2 = myPlot.Add.Signal(Generate.Cos(51));
sig2.LegendText = "Cos";

myPlot.Legend.FontName = "Alumni Sans";
myPlot.Legend.FontSize = 48;
myPlot.Legend.FontColor = Colors.Red;

myPlot.ShowLegend();

myPlot.SavePng("demo.png", 400, 300);
手動凡例項目のカスタムフォント
手動凡例項目のカスタムフォント
凡例(手動凡例項目)で TTF ファイルのカスタムフォントを使用します。
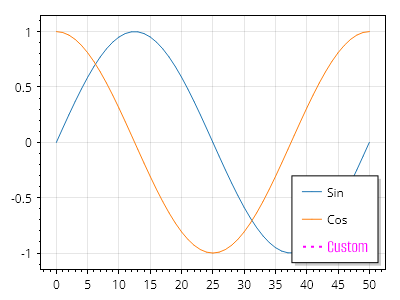
ScottPlot.Plot myPlot = new();

// 指定された名前のフォントでその書体を使用するために、フォントファイルを追加します
Fonts.AddFontFile(
    name: "Alumni Sans",
    path: Path.Combine(Paths.FontFolder, @"AlumniSans/AlumniSans-Regular.ttf"));

var sig1 = myPlot.Add.Signal(Generate.Sin(51));
sig1.LegendText = "Sin";

var sig2 = myPlot.Add.Signal(Generate.Cos(51));
sig2.LegendText = "Cos";

myPlot.Legend.ManualItems.Add(new LegendItem()
{
    LabelText = "カスタム",
    LabelFontName = "Alumni Sans",
    LabelFontSize = 18,
    LabelFontColor = Colors.Magenta,
    LinePattern = LinePattern.Dotted,
    LineWidth = 2,
    LineColor = Colors.Magenta,
});

myPlot.SavePng("demo.png", 400, 300);
タイトル付き凡例
タイトル付き凡例
凡例領域内にタイトルを表示するには、手動の凡例項目をリストの先頭に配置し、必要に応じてスタイルを設定します。
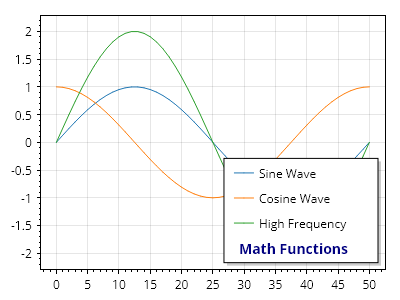
ScottPlot.Plot myPlot = new();

var sig1 = myPlot.Add.Signal(Generate.Sin(51));
sig1.LegendText = "正弦波";

var sig2 = myPlot.Add.Signal(Generate.Cos(51));
sig2.LegendText = "余弦波";

var sig3 = myPlot.Add.Signal(Generate.Sin(51, 2));
sig3.LegendText = "高周波";

LegendItem legendTitle = new()
{
    LabelText = "数学関数",
    LabelFontSize = 14,
    LabelFontColor = Colors.Navy,
    LabelBold = true,
    LabelOffsetX = -20, // 図形を表示するために使われるスペースを補正
};

myPlot.Legend.ManualItems.Add(legendTitle);

myPlot.SavePng("demo.png", 400, 300);
プロットのスタイル設定
How to customize appearance of plots
レシピ
- 背景色
- 軸のカスタマイズ
- パレット
- 反転パレット
- カラーマップ
- 矢印の形状
- 線のスタイル
- スケール係数
- ヘアラインモード
- ダークモード
- カラーマップのステップ
- 色からのカラーマップグラデーション
- 手描き風の線スタイル
- タイトルを非表示にする
- タイトルの配置
- プロットの境界線
- 名前でフォントを設定する
- フォントの太さを設定
- フォントの傾きの設定
- ラベルの下線を設定する
背景色
背景色
図全体、またはデータ領域だけの背景色を個別に制御できます。暗い図の背景を使用する場合、軸が明るい色を使用するように設定する必要がある場合があります
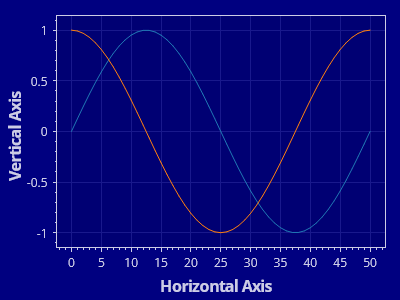
ScottPlot.Plot myPlot = new();

// サンプルデータを使用してプロットをセットアップする
myPlot.Add.Signal(Generate.Sin(51));
myPlot.Add.Signal(Generate.Cos(51));
myPlot.XLabel("水平軸");
myPlot.YLabel("垂直軸");

// 一部の項目は直接スタイル設定する必要がある
myPlot.FigureBackground.Color = Colors.Navy;
myPlot.DataBackground.Color = Colors.Navy.Darken(0.1);
myPlot.Grid.MajorLineColor = Colors.Navy.Lighten(0.1);

// 一部の項目には、複数のプロパティを一度に設定するヘルパーメソッドがある
myPlot.Axes.Color(Colors.Navy.Lighten(0.8));

myPlot.SavePng("demo.png", 400, 300);
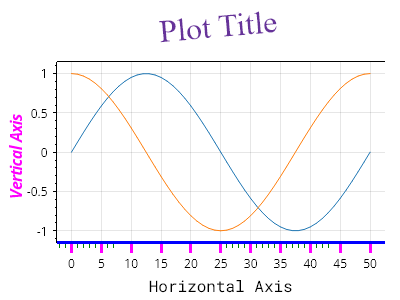
軸のカスタマイズ
軸のカスタマイズ
軸ラベル、目盛り、フレームはすべてカスタマイズできます。
ScottPlot.Plot myPlot = new();

myPlot.Add.Signal(Generate.Sin(51));
myPlot.Add.Signal(Generate.Cos(51));

myPlot.Axes.Title.Label.Text = "プロットのタイトル";
myPlot.Axes.Title.Label.ForeColor = Colors.RebeccaPurple;
myPlot.Axes.Title.Label.FontSize = 32;
myPlot.Axes.Title.Label.FontName = Fonts.Serif;
myPlot.Axes.Title.Label.Rotation = -5;
myPlot.Axes.Title.Label.Bold = false;

myPlot.Axes.Left.Label.Text = "垂直軸";
myPlot.Axes.Left.Label.ForeColor = Colors.Magenta;
myPlot.Axes.Left.Label.Italic = true;

myPlot.Axes.Bottom.Label.Text = "水平軸";
myPlot.Axes.Bottom.Label.Bold = false;
myPlot.Axes.Bottom.Label.FontName = Fonts.Monospace;

myPlot.Axes.Bottom.MajorTickStyle.Length = 10;
myPlot.Axes.Bottom.MajorTickStyle.Width = 3;
myPlot.Axes.Bottom.MajorTickStyle.Color = Colors.Magenta;
myPlot.Axes.Bottom.MinorTickStyle.Length = 5;
myPlot.Axes.Bottom.MinorTickStyle.Width = 0.5f;
myPlot.Axes.Bottom.MinorTickStyle.Color = Colors.Green;
myPlot.Axes.Bottom.FrameLineStyle.Color = Colors.Blue;
myPlot.Axes.Bottom.FrameLineStyle.Width = 3;

myPlot.Axes.Right.FrameLineStyle.Width = 0;

myPlot.SavePng("demo.png", 400, 300);
パレット
パレット
パレットは色の集合であり、Plot のパレットは新しい plottable を追加するときに使用するデフォルトの色を定義します。https://scottplot.net/cookbook/5/palettes/ には、ScottPlot に含まれるすべてのパレットが表示されています。
ScottPlot.Plot myPlot = new();

// 新しい plottable を追加するときに使用するデフォルトのパレットを変更する
myPlot.Add.Palette = new ScottPlot.Palettes.Nord();

for (int i = 0; i < 5; i++)
{
    double[] data = Generate.Sin(100, phase: -i / 20.0f);
    var sig = myPlot.Add.Signal(data);
    sig.LineWidth = 3;
}

myPlot.SavePng("demo.png", 400, 300);
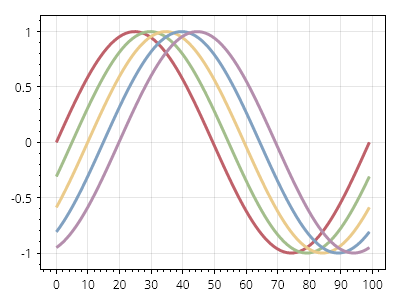
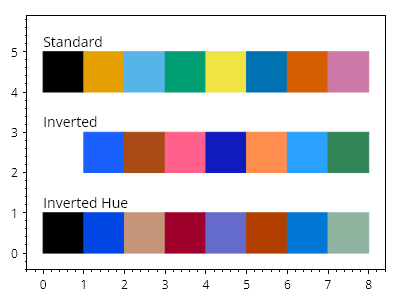
反転パレット
反転パレット
パレットは反転できます。明るい背景でうまく機能するパレットは、反転すれば通常、暗い背景でもうまく機能します。
ScottPlot.Plot myPlot = new();

var palette1 = new ScottPlot.Palettes.ColorblindFriendly();
var palette2 = palette1.Inverted();
var palette3 = palette1.InvertedHue();

for (int x = 0; x < palette1.Count(); x++)
{
    CoordinateRect rect1 = CoordinateRect.UnitSquare.WithTranslation(x, 4);
    CoordinateRect rect2 = CoordinateRect.UnitSquare.WithTranslation(x, 2);
    CoordinateRect rect3 = CoordinateRect.UnitSquare.WithTranslation(x, 0);
    var shape1 = myPlot.Add.Rectangle(rect1);
    var shape2 = myPlot.Add.Rectangle(rect2);
    var shape3 = myPlot.Add.Rectangle(rect3);

    // パレットを使用して色を設定する
    shape1.FillColor = palette1.Colors[x];
    shape2.FillColor = palette2.Colors[x];
    shape3.FillColor = palette3.Colors[x];

    shape1.LineColor = shape1.FillColor;
    shape2.LineColor = shape2.FillColor;
    shape3.LineColor = shape3.FillColor;

}

myPlot.Add.Text("標準", 0, 5.5);
myPlot.Add.Text("反転", 0, 3.5);
myPlot.Add.Text("色相反転", 0, 1.5);
myPlot.HideGrid();

myPlot.SavePng("demo.png", 400, 300);
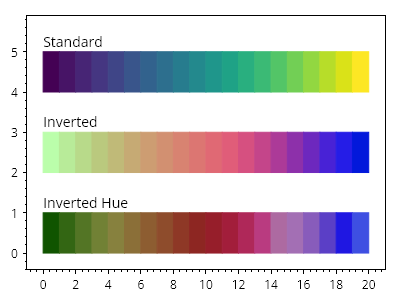
カラーマップ
カラーマップ
カラーマップは、複数の色からなる連続的なグラデーションです。ヒートマップや画像のような連続データに色を付けるために使用できますが、カラーマップを直接サンプリングして色のコレクションを作成することもできます。https://scottplot.net/cookbook/5/colormaps/ には、ScottPlot に含まれるすべてのカラーマップが表示されています。
ScottPlot.Plot myPlot = new();

var colormap1 = new ScottPlot.Colormaps.Viridis();
var colormap2 = colormap1.Invert();
var colormap3 = colormap1.InvertHue();

int steps = 20;
for (int x = 0; x < steps; x++)
{
    CoordinateRect rect1 = CoordinateRect.UnitSquare.WithTranslation(x, 4);
    CoordinateRect rect2 = CoordinateRect.UnitSquare.WithTranslation(x, 2);
    CoordinateRect rect3 = CoordinateRect.UnitSquare.WithTranslation(x, 0);
    var shape1 = myPlot.Add.Rectangle(rect1);
    var shape2 = myPlot.Add.Rectangle(rect2);
    var shape3 = myPlot.Add.Rectangle(rect3);

    // カラーマップを使用して色を設定する
    double fraction = (double)x / (steps - 1);
    shape1.FillColor = colormap1.GetColor(fraction);
    shape2.FillColor = colormap2.GetColor(fraction);
    shape3.FillColor = colormap3.GetColor(fraction);

    shape1.LineColor = shape1.FillColor;
    shape2.LineColor = shape2.FillColor;
    shape3.LineColor = shape3.FillColor;
}

myPlot.Add.Text("標準", 0, 5.5);
myPlot.Add.Text("反転", 0, 3.5);
myPlot.Add.Text("色相反転", 0, 1.5);
myPlot.HideGrid();

myPlot.SavePng("demo.png", 400, 300);
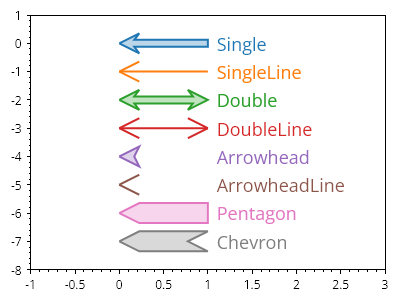
矢印の形状
矢印の形状
多くの標準的な矢印形状が利用できます
ScottPlot.Plot myPlot = new();

ArrowShape[] arrowShapes = Enum.GetValues<ArrowShape>().ToArray();

for (int i = 0; i < arrowShapes.Length; i++)
{
    Coordinates arrowTip = new(0, -i);
    Coordinates arrowBase = arrowTip.WithDelta(1, 0);

    var arrow = myPlot.Add.Arrow(arrowBase, arrowTip);
    arrow.ArrowShape = arrowShapes[i].GetShape();

    var txt = myPlot.Add.Text(arrowShapes[i].ToString(), arrowBase.WithDelta(.1, 0));
    txt.LabelFontColor = arrow.ArrowLineColor;
    txt.LabelAlignment = Alignment.MiddleLeft;
    txt.LabelFontSize = 18;
}

myPlot.Axes.SetLimits(-1, 3, -arrowShapes.Length, 1);
myPlot.HideGrid();

myPlot.SavePng("demo.png", 400, 300);
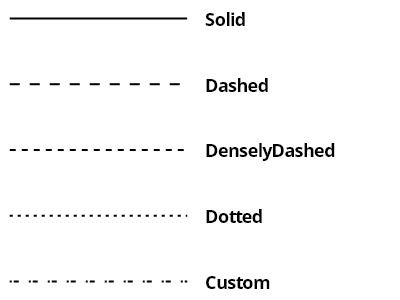
線のスタイル
線のスタイル
多くのプロットタイプには、カスタマイズ可能な LineStyle があります。
ScottPlot.Plot myPlot = new();

List<LinePattern> patterns = [];
patterns.AddRange(LinePattern.GetAllPatterns());
patterns.Add(new([2, 2, 5, 10], 0, "Custom"));

for (int i = 0; i < patterns.Count; i++)
{
    LinePattern pattern = patterns[i];

    var line = myPlot.Add.Line(0, -i, 1, -i);
    line.LinePattern = pattern;
    line.LineWidth = 2;
    line.Color = Colors.Black;

    var txt = myPlot.Add.Text(patterns[i].Name, 1.1, -i);
    txt.LabelFontSize = 18;
    txt.LabelBold = true;
    txt.LabelFontColor = Colors.Black;
    txt.LabelAlignment = Alignment.MiddleLeft;
}

myPlot.Axes.Margins(right: 1);
myPlot.HideGrid();
myPlot.Layout.Frameless();

myPlot.ShowLegend();

myPlot.SavePng("demo.png", 400, 300);
スケール係数
スケール係数
画像のすべてのコンポーネントは、ScaleFactor プロパティを調整することでサイズを拡大または縮小できます。これは、ディスプレイスケーリングが有効になっている高 DPI ディスプレイで見栄えのよい画像を作成するのに非常に便利です。
ScottPlot.Plot myPlot = new();

myPlot.ScaleFactor = 2;
myPlot.Add.Signal(Generate.Sin());
myPlot.Add.Signal(Generate.Cos());

myPlot.SavePng("demo.png", 400, 300);
ヘアラインモード
ヘアラインモード
ヘアラインモードを使用すると、軸フレーム、目盛り、グリッド線が、スケール係数に関係なく常に 1 ピクセル幅でレンダリングされます。大きなスケール係数を使用している場合に、インタラクティブなプロットをより滑らかに感じられるようにするには、ヘアラインモードを有効にします。
ScottPlot.Plot myPlot = new();

myPlot.ScaleFactor = 2;
myPlot.Add.Signal(Generate.Sin());
myPlot.Add.Signal(Generate.Cos());

myPlot.Axes.Hairline(true);

myPlot.SavePng("demo.png", 400, 300);
ダークモード
ダークモード
主要なプロットコンポーネントの色をダークテーマに合うものに設定することで、ダークモードを使用してプロットを作成できます。
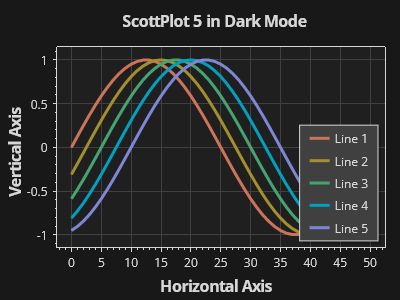
ScottPlot.Plot myPlot = new();

// プロットに追加される新しい項目の色付けに使用するカラーパレットを設定する
myPlot.Add.Palette = new ScottPlot.Palettes.Penumbra();

// プロットに要素を追加する
for (int i = 0; i < 5; i++)
{
    var sig = myPlot.Add.Signal(Generate.Sin(51, phase: -.05 * i));
    sig.LineWidth = 3;
    sig.LegendText = $"線 {i + 1}";
}
myPlot.XLabel("水平軸");
myPlot.YLabel("垂直軸");
myPlot.Title("ダークモードの ScottPlot 5");
myPlot.ShowLegend();

// 図の色を変更する
myPlot.FigureBackground.Color = Color.FromHex("#181818");
myPlot.DataBackground.Color = Color.FromHex("#1f1f1f");

// 軸とグリッドの色を変更する
myPlot.Axes.Color(Color.FromHex("#d7d7d7"));
myPlot.Grid.MajorLineColor = Color.FromHex("#404040");

// 凡例の色を変更する
myPlot.Legend.BackgroundColor = Color.FromHex("#404040");
myPlot.Legend.FontColor = Color.FromHex("#d7d7d7");
myPlot.Legend.OutlineColor = Color.FromHex("#d7d7d7");

myPlot.SavePng("demo.png", 400, 300);
カラーマップのステップ
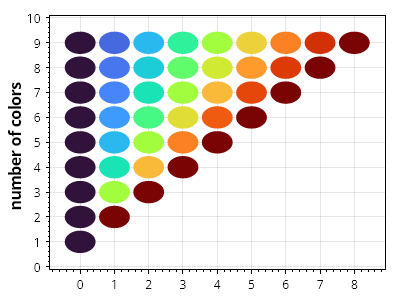
カラーマップのステップ
カラーマップは、プロット可能なオブジェクトに適用できる離散的な色のコレクションを生成するために使用できます。
ScottPlot.Plot myPlot = new();

IColormap colormap = new ScottPlot.Colormaps.Turbo();

for (int count = 1; count < 10; count++)
{
    double[] xs = Generate.Consecutive(count);
    double[] ys = Generate.Repeating(count, count);
    Color[] colors = colormap.GetColors(count);

    for (int i = 0; i < count; i++)
    {
        var circle = myPlot.Add.Circle(xs[i], ys[i], 0.45);
        circle.FillColor = colors[i];
        circle.LineWidth = 0;
    }
}

myPlot.YLabel("色の数");

myPlot.SavePng("demo.png", 400, 300);
色からのカラーマップグラデーション
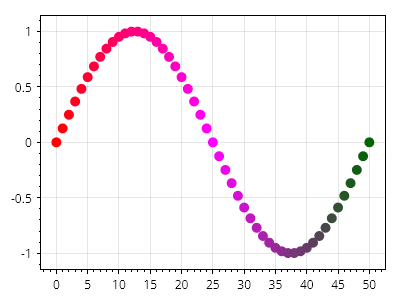
色からのカラーマップグラデーション
カラーマップは、色の集合間のグラデーションとして作成できます。
ScottPlot.Plot myPlot = new();

Color[] colors = [Colors.Red, Colors.Magenta, Colors.DarkGreen];
IColormap myColormap = Colormap.FromColors(colors);

double[] xs = Generate.Consecutive(51);
double[] ys = Generate.Sin(51);
var markers = myPlot.Add.Markers(xs, ys);
markers.Colormap = myColormap;

myPlot.SavePng("demo.png", 400, 300);
手描き風の線スタイル
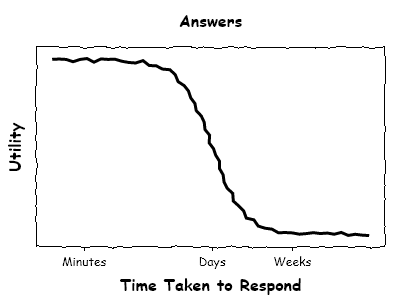
手描き風の線スタイル
手描き風の線スタイルを有効にすると、コミカルな効果のために波打った線を使用する XKCD スタイルのグラフを模倣したチャートを作成できます。
ScottPlot.Plot myPlot = new();

double[] xs = Generate.Consecutive(100);
double[] values1 = Generate.Sigmoidal(xs.Length, -1, 2);

// 手描き風の散布図を作成する
var sp = myPlot.Add.ScatterLine(xs, values1);
sp.LineStyle.HandDrawn = true;
sp.LineStyle.HandDrawnJitter = 2;
sp.LineWidth = 3;
sp.LineColor = Colors.Black;

// 軸フレームが手描き風に見えるように設定する
myPlot.HideGrid();
myPlot.Axes.GetAxes().ToList().ForEach(x => x.FrameLineStyle.HandDrawn = true);

// 軸タイトルと目盛りラベルにコミカルなフォントを使用する
myPlot.Title("回答");
myPlot.YLabel("効用");
myPlot.XLabel("応答にかかった時間");
myPlot.Axes.Title.Label.FontName = "Comic Sans MS";
myPlot.Axes.Left.Label.FontName = "Comic Sans MS";
myPlot.Axes.Bottom.Label.FontName = "Comic Sans MS";
myPlot.Axes.Bottom.TickLabelStyle.FontName = "Comic Sans MS";

// 手動で配置した水平軸の目盛りを使用する
myPlot.Axes.Left.TickGenerator = new ScottPlot.TickGenerators.EmptyTickGenerator();
myPlot.Axes.Bottom.SetTicks([10, 50, 75], ["分", "日", "週"]);

myPlot.SavePng("demo.png", 400, 300);
タイトルを非表示にする
タイトルを非表示にする
タイトルの表示を簡単に無効化するショートカットメソッドがあります。この方法を使用すると、元のテキストを保持したまま、後でタイトルを再表示できます。

ScottPlot.Plot myPlot = new();

// サンプルデータを追加する
myPlot.Add.Signal(Generate.Sin());
myPlot.Add.Signal(Generate.Cos());

// タイトル領域にテキストを表示する
myPlot.Title("これはタイトルの例です");

// タイトルを非表示にする
myPlot.Title(false);

myPlot.SavePng("demo.png", 400, 300);
タイトルの配置
タイトルの配置
タイトルはデフォルトでデータ領域の中央に配置されますが、フラグを使用すると、代わりに図全体を基準として中央に配置できます
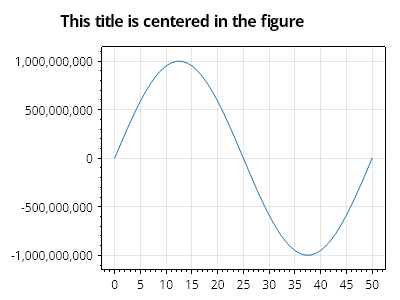
ScottPlot.Plot myPlot = new();

myPlot.Add.Signal(Generate.Sin(51, mult: 1e9));
myPlot.Title("このタイトルは図全体の中央に配置されます");
myPlot.Axes.Title.FullFigureCenter = true;

myPlot.SavePng("demo.png", 400, 300);
プロットの境界線
プロットの境界線
プロットには、図またはデータ領域の周囲に描画する境界線を割り当てることができます。
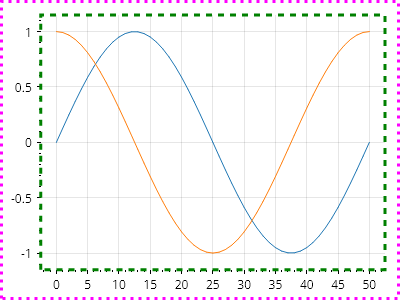
ScottPlot.Plot myPlot = new();

myPlot.Add.Signal(Generate.Sin());
myPlot.Add.Signal(Generate.Cos());

myPlot.FigureBorder = new()
{
    Color = Colors.Magenta,
    Width = 3,
    Pattern = LinePattern.Dotted,
};

myPlot.DataBorder = new()
{
    Color = Colors.Green,
    Width = 3,
    Pattern = LinePattern.DenselyDashed,
};

// カスタム境界線だけが表示されるように、軸フレーム線を非表示にする
myPlot.Axes.Frame(false);

myPlot.SavePng("demo.png", 400, 300);
名前でフォントを設定する
名前でフォントを設定する
フォントを名前で設定し、一般的なプロットコンポーネントに適用します。
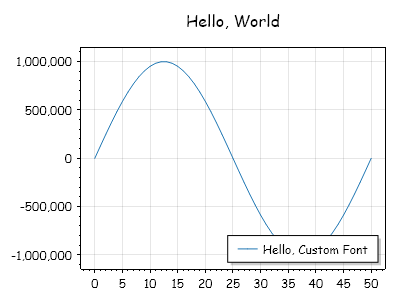
ScottPlot.Plot myPlot = new();

myPlot.Font.Set("Comic Sans MS");
myPlot.Title("こんにちは、世界");
var sig = myPlot.Add.Signal(Generate.Sin(51, mult: 1e6));
sig.LegendText = "こんにちは、カスタムフォント";

myPlot.SavePng("demo.png", 400, 300);
フォントの太さを設定
フォントの太さを設定
フォントの太さはカスタマイズできます。
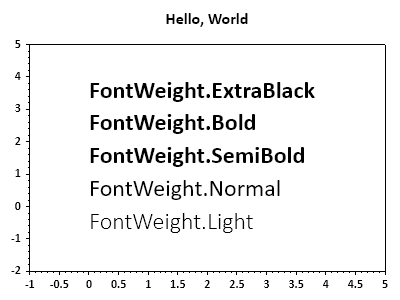
ScottPlot.Plot myPlot = new();

myPlot.Font.Set("Calibri"); // 既存の多数のプロットラベルに適用
myPlot.Title("Hello, World");

FontWeight[] weights = [FontWeight.Light, FontWeight.Normal,
    FontWeight.SemiBold, FontWeight.Bold, FontWeight.ExtraBlack];

for (int i = 0; i < weights.Length; i++)
{
    FontWeight weight = weights[i];
    myPlot.Font.Set("Calibri", weight: weight); // 新しいラベルに適用
    var text = myPlot.Add.Text($"FontWeight.{weight}", 0, i);
    text.LabelFontSize = 24;
}

myPlot.Axes.SetLimits(-1, 5, -2, weights.Length);
myPlot.HideGrid();

myPlot.SavePng("demo.png", 400, 300);
フォントの傾きの設定
フォントの傾きの設定
フォントの傾きはカスタマイズできます。
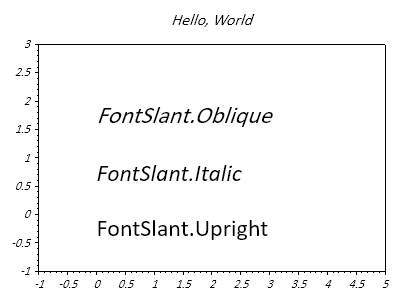
ScottPlot.Plot myPlot = new();

myPlot.Font.Set("Calibri", slant: FontSlant.Italic); // 既存の多くのプロットラベルに適用する
myPlot.Title("Hello, World");

FontSlant[] slants = [FontSlant.Upright, FontSlant.Italic, FontSlant.Oblique];

for (int i = 0; i < slants.Length; i++)
{
    FontSlant slant = slants[i];
    myPlot.Font.Set("Calibri", slant: slant); // 新しいラベルに適用する
    var text = myPlot.Add.Text($"FontSlant.{slant}", 0, i);
    text.LabelFontSize = 24;
}

myPlot.Axes.SetLimits(-1, 5, -1, slants.Length);
myPlot.HideGrid();

myPlot.SavePng("demo.png", 400, 300);
ラベルの下線を設定する
ラベルの下線を設定する
下線はラベルスタイルに追加できます。下線の太さとオフセットもカスタマイズできます。
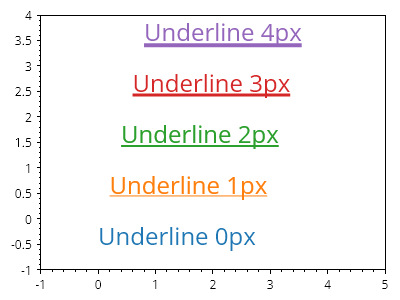
ScottPlot.Plot myPlot = new();

for (int i = 0; i < 5; i++)
{
    var text = myPlot.Add.Text($"Underline {i}px", i / 5.0, i);
    text.LabelFontSize = 24;
    text.LabelFontColor = ScottPlot.Palette.Default.GetColor(i);
    text.LabelUnderline = true;
    text.LabelUnderlineWidth = i;
    text.LabelUnderlineOffset = 2 + i / 2;
}

myPlot.Axes.SetLimits(-1, 5, -1, 4);
myPlot.HideGrid();

myPlot.SavePng("demo.png", 400, 300);
サンプルデータ
ScottPlot has many built-in utilities for generating sample data.
レシピ
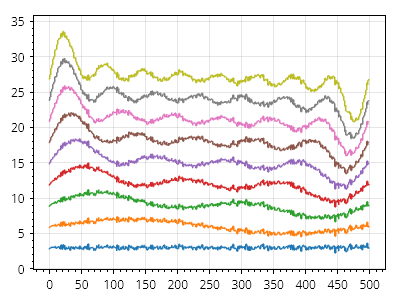
複数の正弦波
複数の正弦波
このレシピでは、異なる周波数を持つ複数の正弦波を含むノイズの多い波形の作成方法を示します。
ScottPlot.Plot myPlot = new();

double[] values = Generate.RandomNormal(500, stdDev: 0.2);

for (int i = 1; i < 10; i++)
{
    var sig = myPlot.Add.Signal(values);
    sig.Data.YOffset = i * 3;
    sig.LineWidth = 1.5f;
    values = Generate.AddSin(values, oscillations: i);
}

myPlot.SavePng("demo.png", 400, 300);
ヒストグラム
Histograms graphically represent the distribution of numerical data by grouping values into ranges (bins) and displaying the frequency or count of points in each bin.
レシピ
- ヒストグラムのクイックスタート
- 固定サイズのビンを使用したヒストグラム
- 塗りつぶしヒストグラム
- ヒストグラムバー
- 確率のヒストグラム
- 確率曲線付きヒストグラム
- 第2軸の確率を持つヒストグラム
- 複数のヒストグラム
- 累積確率ヒストグラム
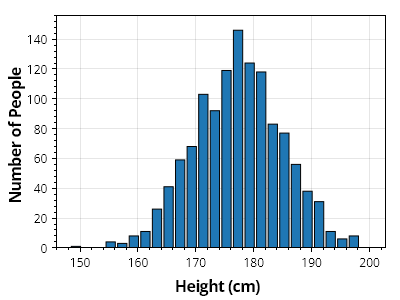
ヒストグラムのクイックスタート
ヒストグラムのクイックスタート
ヒストグラムは値のコレクションから作成できます。
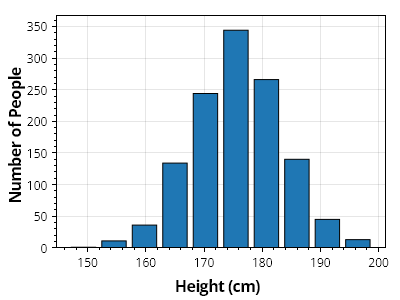
ScottPlot.Plot myPlot = new();

// 値のコレクションからヒストグラムを作成する
double[] heights = SampleData.MaleHeights();
var hist = ScottPlot.Statistics.Histogram.WithBinCount(10, heights);

// ヒストグラムを棒グラフとして表示する
var barPlot = myPlot.Add.Bars(hist.Bins, hist.Counts);

// 各棒のサイズをビンの幅よりわずかに小さくする
foreach (var bar in barPlot.Bars)
{
    bar.Size = hist.FirstBinSize * .8;
}

// プロットのスタイルをカスタマイズする
myPlot.Axes.Margins(bottom: 0);
myPlot.YLabel("人数");
myPlot.XLabel("身長 (cm)");

myPlot.SavePng("demo.png", 400, 300);
固定サイズのビンを使用したヒストグラム
固定サイズのビンを使用したヒストグラム
ヒストグラムは、手動で定義したビンサイズを使用して作成できます。
ScottPlot.Plot myPlot = new();

// 値のコレクションからヒストグラムを作成する
double[] heights = SampleData.MaleHeights();
var hist = ScottPlot.Statistics.Histogram.WithBinSize(2, heights);

// ヒストグラムを棒グラフとして表示する
var barPlot = myPlot.Add.Bars(hist.Bins, hist.Counts);

// 各棒のサイズをビンの幅よりわずかに小さくする
foreach (var bar in barPlot.Bars)
{
    bar.Size = hist.FirstBinSize * .8;
}

// プロットのスタイルをカスタマイズする
myPlot.Axes.Margins(bottom: 0);
myPlot.YLabel("人数");
myPlot.XLabel("身長 (cm)");

myPlot.SavePng("demo.png", 400, 300);
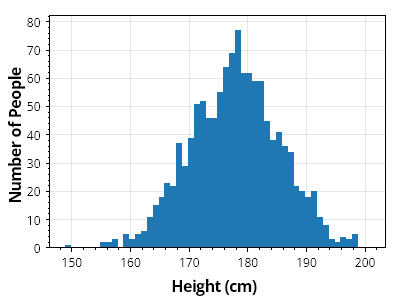
塗りつぶしヒストグラム
塗りつぶしヒストグラム
塗りつぶしヒストグラム(バーの間に見える隙間がないもの)は、バーの幅をビンサイズに設定することで実現できます。ただし、アンチエイリアシングのアーティファクトにより、バーの間に白い線が表示される場合があります。このようなプロットの見た目を改善するには、各バーのアンチエイリアシングを無効にします。
ScottPlot.Plot myPlot = new();

// 値のコレクションからヒストグラムを作成する
double[] heights = SampleData.MaleHeights();
var hist = ScottPlot.Statistics.Histogram.WithBinSize(1, heights);

// ヒストグラムをバープロットとして表示する
var barPlot = myPlot.Add.Bars(hist.Bins, hist.Counts);

// 各バーのスタイルをカスタマイズする
foreach (var bar in barPlot.Bars)
{
    bar.Size = hist.FirstBinSize;
    bar.LineWidth = 0;
    bar.FillStyle.AntiAlias = false;
}

// プロットスタイルをカスタマイズする
myPlot.Axes.Margins(bottom: 0);
myPlot.YLabel("人数");
myPlot.XLabel("身長 (cm)");

myPlot.SavePng("demo.png", 400, 300);
ヒストグラムバー
ヒストグラムバー
ヒストグラムの度数を表示する棒グラフを簡単に作成できるように、ヘルパーメソッドとプロット型が作成されています。ヒストグラムの更新はリアルタイムに表示され、プロットは最新のデータを表示するように自動的に更新されることに注意してください。
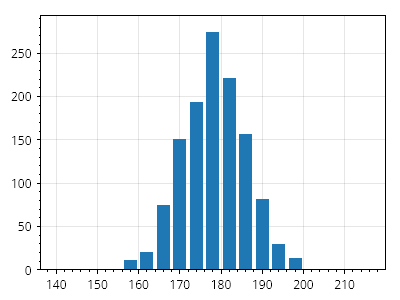
ScottPlot.Plot myPlot = new();

// 空のヒストグラムを作成し、棒グラフとして表示する
var hist = ScottPlot.Statistics.Histogram.WithBinCount(count: 20, minValue: 140, maxValue: 220);
var histPlot = myPlot.Add.Histogram(hist);
histPlot.BarWidthFraction = 0.8;

// 新しいデータが追加されると、ヒストグラムの度数は自動的に更新される
double[] newData = SampleData.MaleHeights();
hist.AddRange(newData);

myPlot.SavePng("demo.png", 400, 300);
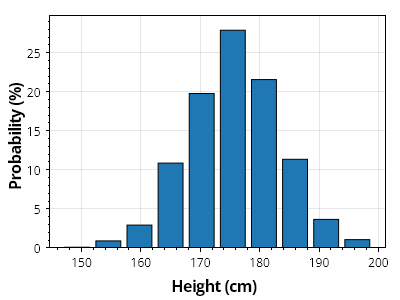
確率のヒストグラム
確率のヒストグラム
ヒストグラムは、各値がビン内に入る確率として表示できます
ScottPlot.Plot myPlot = new();

// 値のコレクションからヒストグラムを作成する
double[] heights = SampleData.MaleHeights();
var hist = ScottPlot.Statistics.Histogram.WithBinCount(10, heights);

// ヒストグラムを棒グラフとして表示する
var barPlot = myPlot.Add.Bars(hist.Bins, hist.GetProbability(100));

// 各棒のスタイルをカスタマイズする
foreach (var bar in barPlot.Bars)
{
    bar.Size = hist.FirstBinSize * 0.8;
}

// プロットのスタイルをカスタマイズする
myPlot.Axes.Margins(bottom: 0);
myPlot.YLabel("確率 (%)");
myPlot.XLabel("身長 (cm)");

myPlot.SavePng("demo.png", 400, 300);
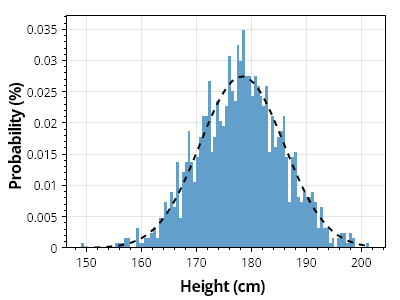
確率曲線付きヒストグラム
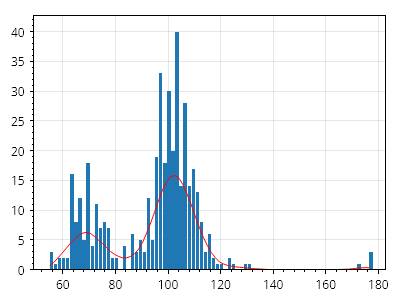
確率曲線付きヒストグラム
ガウス分布のサンプルに対して確率曲線を生成できます。
ScottPlot.Plot myPlot = new();

// 値のコレクションからヒストグラムを作成する
double[] heights = SampleData.MaleHeights();
var hist = ScottPlot.Statistics.Histogram.WithBinCount(100, heights);

// ヒストグラムを棒グラフとして表示する
var barPlot = myPlot.Add.Bars(hist.Bins, hist.GetProbability());

// 各バーのスタイルをカスタマイズする
foreach (var bar in barPlot.Bars)
{
    bar.Size = hist.FirstBinSize;
    bar.LineWidth = 0;
    bar.FillStyle.AntiAlias = false;
    bar.FillColor = Colors.C0.Lighten(.3);
}

// ヒストグラムの上に確率曲線をプロットする
ScottPlot.Statistics.ProbabilityDensity pd = new(heights);
double[] xs = Generate.Range(heights.Min(), heights.Max(), 1);
double sumBins = hist.Bins.Select(x => pd.GetY(x)).Sum();
double[] ys = pd.GetYs(xs, 1.0 / sumBins);

var curve = myPlot.Add.ScatterLine(xs, ys);
curve.LineWidth = 2;
curve.LineColor = Colors.Black;
curve.LinePattern = LinePattern.DenselyDashed;

// プロットのスタイルをカスタマイズする
myPlot.Axes.Margins(bottom: 0);
myPlot.YLabel("確率 (%)");
myPlot.XLabel("身長 (cm)");

myPlot.SavePng("demo.png", 400, 300);
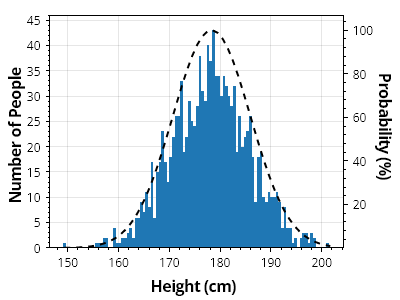
第2軸の確率を持つヒストグラム
第2軸の確率を持つヒストグラム
確率曲線を第2軸に配置することで、カウントをパーセント単位の確率と並べて表示できます
ScottPlot.Plot myPlot = new();

// 値のコレクションからヒストグラムを作成する
double[] heights = SampleData.MaleHeights();
var hist = ScottPlot.Statistics.Histogram.WithBinCount(100, heights);

// ヒストグラムを棒グラフとして表示する
var barPlot = myPlot.Add.Bars(hist.Bins, hist.Counts);

// 各棒のスタイルをカスタマイズする
foreach (var bar in barPlot.Bars)
{
    bar.Size = hist.FirstBinSize;
    bar.LineWidth = 0;
    bar.FillStyle.AntiAlias = false;
}

// 確率曲線を第2軸に追加する
ScottPlot.Statistics.ProbabilityDensity pd = new(heights);
double[] xs = Generate.Range(heights.Min(), heights.Max(), 1);
double[] ys = pd.GetYs(xs, 100);

var curve = myPlot.Add.ScatterLine(xs, ys);
curve.Axes.YAxis = myPlot.Axes.Right;
curve.LineWidth = 2;
curve.LineColor = Colors.Black;
curve.LinePattern = LinePattern.DenselyDashed;

// プロットのスタイルをカスタマイズする
myPlot.Axes.Margins(bottom: 0);
myPlot.YLabel("人数");
myPlot.XLabel("身長 (cm)");
myPlot.Axes.Right.Label.Text = "確率 (%)";

myPlot.SavePng("demo.png", 400, 300);
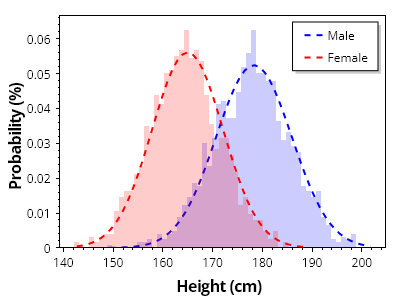
複数のヒストグラム
複数のヒストグラム
半透明のバーを使用して、重なり合うデータセットのヒストグラムを表示する方法を示します
ScottPlot.Plot myPlot = new();

// 値のコレクションからヒストグラムを作成する
double[][] heightsByGroup = { SampleData.MaleHeights(), SampleData.FemaleHeights() };
string[] groupNames = { "男性", "女性" };
Color[] groupColors = { Colors.Blue, Colors.Red };

for (int i = 0; i < 2; i++)
{
    double[] heights = heightsByGroup[i];
    var hist = ScottPlot.Statistics.Histogram.WithBinSize(1, heights);

    // ヒストグラムを棒グラフとして表示する
    var barPlot = myPlot.Add.Bars(hist.Bins, hist.GetProbability());

    // 各バーのスタイルをカスタマイズする
    foreach (var bar in barPlot.Bars)
    {
        bar.Size = hist.FirstBinSize;
        bar.LineWidth = 0;
        bar.FillStyle.AntiAlias = false;
        bar.FillColor = groupColors[i].WithAlpha(.2);
    }

    // ヒストグラムの上に確率曲線をプロットする
    ScottPlot.Statistics.ProbabilityDensity pd = new(heights);
    double[] xs = Generate.Range(heights.Min(), heights.Max(), 1);
    double scale = 1.0 / hist.Bins.Select(x => pd.GetY(x)).Sum();
    double[] ys = pd.GetYs(xs, scale);

    var curve = myPlot.Add.ScatterLine(xs, ys);
    curve.LineWidth = 2;
    curve.LineColor = groupColors[i];
    curve.LinePattern = LinePattern.DenselyDashed;
    curve.LegendText = groupNames[i];
}

// プロットのスタイルをカスタマイズする
myPlot.Legend.Alignment = Alignment.UpperRight;
myPlot.Axes.Margins(bottom: 0);
myPlot.YLabel("確率 (%)");
myPlot.XLabel("身長 (cm)");
myPlot.HideGrid();

myPlot.SavePng("demo.png", 400, 300);
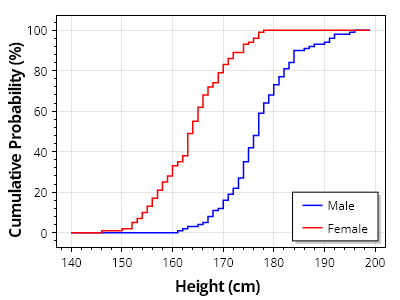
累積確率ヒストグラム
累積確率ヒストグラム
累積確率ヒストグラムは、各ビンまでの確率または相対度数の累積和を表し、確率分布の累計を示します。これは、複数の母集団の分布を評価および比較する場合に特に有用です。
ScottPlot.Plot myPlot = new();

// 値のコレクションからヒストグラムを作成する
double[][] heightsByGroup = { SampleData.MaleHeights(100), SampleData.FemaleHeights(100) };
string[] groupNames = { "男性", "女性" };
Color[] groupColors = { Colors.Blue, Colors.Red };

for (int i = 0; i < 2; i++)
{
    var hist = ScottPlot.Statistics.Histogram.WithBinSize(1, firstBin: 140, lastBin: 200);
    hist.AddRange(heightsByGroup[i]);

    var curve = myPlot.Add.ScatterLine(hist.Bins, hist.GetCumulativeProbability(100));
    curve.LineWidth = 1.5f;
    curve.LineColor = groupColors[i];
    curve.LegendText = groupNames[i];
    curve.ConnectStyle = ConnectStyle.StepVertical;
}

// プロットのスタイルをカスタマイズする
myPlot.Legend.Alignment = Alignment.LowerRight;
myPlot.YLabel("累積確率 (%)");
myPlot.XLabel("身長 (cm)");

myPlot.SavePng("demo.png", 400, 300);
国際化
Using ScottPlot across cultures with different text and numeric requirements.
レシピ
対応フォントの検出
対応フォントの検出
ScottPlot には、国際文字を含む可能性のあるテキストの表示に最適なインストール済みフォントを特定するのに役立つフォント検出メソッドが用意されています。
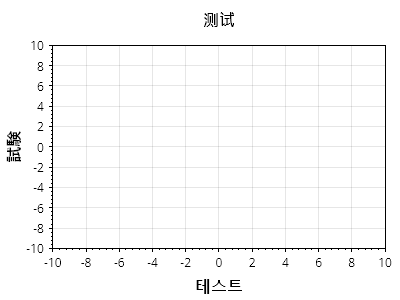
ScottPlot.Plot myPlot = new();

string chinese = "测试";
myPlot.Axes.Title.Label.Text = chinese;
myPlot.Axes.Title.Label.FontName = Fonts.Detect(chinese);

string japanese = "試験";
myPlot.Axes.Left.Label.Text = japanese;
myPlot.Axes.Left.Label.FontName = Fonts.Detect(japanese);

string korean = "테스트";
myPlot.Axes.Bottom.Label.Text = korean;
myPlot.Axes.Bottom.Label.FontName = Fonts.Detect(korean);

myPlot.SavePng("demo.png", 400, 300);
自動フォント検出
自動フォント検出
Plot の Style クラスには、一般的なプロットオブジェクトのフォントを、それらに含まれる文字を表示できる可能性が最も高いフォントへ自動的に設定するメソッドが含まれています。
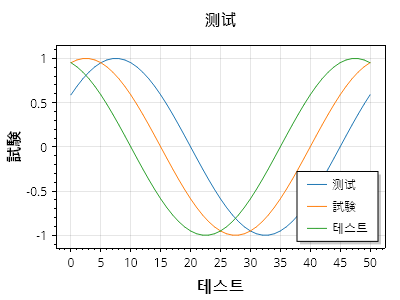
ScottPlot.Plot myPlot = new();

var sig1 = myPlot.Add.Signal(Generate.Sin(phase: .1));
var sig2 = myPlot.Add.Signal(Generate.Sin(phase: .2));
var sig3 = myPlot.Add.Signal(Generate.Sin(phase: .3));

sig1.LegendText = "测试"; // 中国語
sig2.LegendText = "試験"; // 日本語
sig3.LegendText = "테스트"; // 韓国語
myPlot.ShowLegend();

myPlot.Title("测试"); // 中国語
myPlot.YLabel("試験"); // 日本語
myPlot.XLabel("테스트"); // 韓国語

myPlot.Font.Automatic(); // 各項目の内容に基づいてフォントを設定する

myPlot.SavePng("demo.png", 400, 300);
カーネル密度推定
Kernel Density Estimation (KDE) can be used to estimate a PDF for a histogram, allowing the creation of density plots
レシピ
密度プロット
密度プロット
密度プロットは、KDEを使用してPDFを推定します。
ScottPlot.Plot myPlot = new();

var ys = SampleData.Faithful;

var hist = Histogram.WithBinCount(80, ys);

var histPlot = myPlot.Add.Histogram(hist);
histPlot.BarWidthFraction = 0.8;

var densityEstimate = hist.Bins.Select((x, i) => KernelDensity.Estimate(x, ys)).ToArray();
double scale = ys.Length;

var rescaledDensityEstimate = densityEstimate.Select(x => x * scale).ToArray();

var scat = myPlot.Add.Scatter(hist.Bins, rescaledDensityEstimate, Colors.Red);
scat.MarkerSize = 0;

myPlot.SavePng("demo.png", 400, 300);
密度プロットのカーネル
密度プロットのカーネル
複数のカーネルを選択できます。
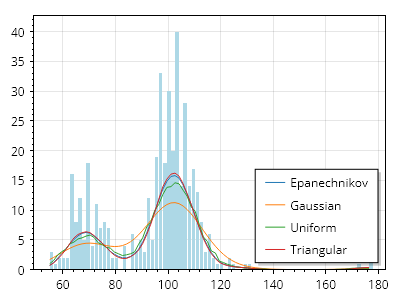
ScottPlot.Plot myPlot = new();

var ys = SampleData.Faithful;

var hist = Histogram.WithBinCount(80, ys);

var histPlot = myPlot.Add.Histogram(hist);
histPlot.BarWidthFraction = 0.8;
foreach (var bar in histPlot.Bars)
{
    bar.FillColor = Colors.LightBlue;
}

foreach (var kernel in Enum.GetValues<KdeKernel>())
{
    var densityEstimate = hist.Bins.Select((x, i) => KernelDensity.Estimate(x, ys, kernel)).ToArray();
    double scale = ys.Length;

    var rescaledDensityEstimate = densityEstimate.Select(x => x * scale).ToArray();

    var scat = myPlot.Add.Scatter(hist.Bins, rescaledDensityEstimate);
    scat.MarkerSize = 0;
    scat.LegendText = kernel.ToString();
}

myPlot.SavePng("demo.png", 400, 300);
レイアウト
How to customize data area size and figure padding
レシピ
フレームレスプロット
フレームレスプロット
データ領域のみを含み、軸を含まないプロットを作成する方法。
ScottPlot.Plot myPlot = new();

myPlot.Add.Signal(Generate.Sin(51));
myPlot.Add.Signal(Generate.Cos(51));

// データ領域が図全体を覆うようにする
myPlot.Layout.Frameless();

// データ領域の背景を設定して、そのサイズを確認できるようにする
myPlot.DataBackground.Color = Colors.WhiteSmoke;

myPlot.SavePng("demo.png", 400, 300);
固定パディング
固定パディング
プロットは、データ領域の各辺に固定量のパディングを確保するように配置できます
ScottPlot.Plot myPlot = new();

// サンプルデータをプロットに追加する
myPlot.Add.Signal(Generate.Sin(51));
myPlot.Add.Signal(Generate.Cos(51));

// 各辺に固定量のピクセルパディングを使用する
PixelPadding padding = new(100, 50, 100, 50);
myPlot.Layout.Fixed(padding);

// 図の背景を暗くして、その寸法を確認できるようにする
myPlot.FigureBackground.Color = Colors.LightBlue;
myPlot.DataBackground.Color = Colors.White;

myPlot.SavePng("demo.png", 400, 300);
固定長方形
固定長方形
プロットは、データがピクセル単位で定義された固定長方形の内側に描画されるように配置できます
ScottPlot.Plot myPlot = new();

// サンプルデータをプロットに追加する
myPlot.Add.Signal(Generate.Sin(51));
myPlot.Add.Signal(Generate.Cos(51));

// 固定長方形の内側にレンダリングするようにデータ領域を設定する
PixelSize size = new(300, 200);
Pixel offset = new(50, 50);
PixelRect rect = new(size, offset);
myPlot.Layout.Fixed(rect);

// Figure の背景を暗くして、その寸法を確認できるようにする
myPlot.FigureBackground.Color = Colors.LightBlue;
myPlot.DataBackground.Color = Colors.White;

myPlot.SavePng("demo.png", 400, 300);
Multiplot
Use Multiplot to create figures with multiple subplots
レシピ
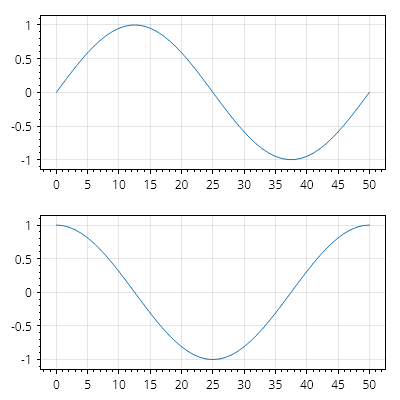
Multiplot クイックスタート
Multiplot クイックスタート
Multiplot クラスを使用して、複数のサブプロットを持つ図を作成します。
ScottPlot.Multiplot multiplot = new();

// 2つのサブプロットを使用するように multiplot を構成する
multiplot.AddPlots(2);
Plot plot1 = multiplot.Subplots.GetPlot(0);
Plot plot2 = multiplot.Subplots.GetPlot(1);

// 各サブプロットにサンプルデータを追加する
plot1.Add.Signal(Generate.Sin());
plot2.Add.Signal(Generate.Cos());

multiplot.SavePng("demo.png", 400, 400);
Multiplot の列
Multiplot の列
Multiplot の Layout プロパティは、列レイアウトを実現するようにカスタマイズできます。
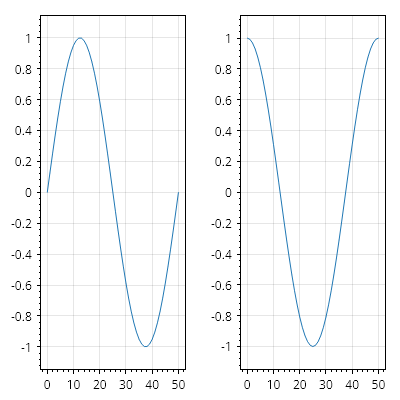
ScottPlot.Multiplot multiplot = new();

// 2 つのサブプロットを使用するように multiplot を設定する
multiplot.AddPlots(2);
Plot plot1 = multiplot.Subplots.GetPlot(0);
Plot plot2 = multiplot.Subplots.GetPlot(1);

// 各サブプロットにサンプルデータを追加する
plot1.Add.Signal(Generate.Sin());
plot2.Add.Signal(Generate.Cos());

// カスタムレイアウトを適用する
multiplot.Layout = new ScottPlot.MultiplotLayouts.Columns();

multiplot.SavePng("demo.png", 400, 400);
Multiplot グリッド
Multiplot グリッド
Multiplot の Layout プロパティは、グリッドレイアウトを実現するためにカスタマイズできます。
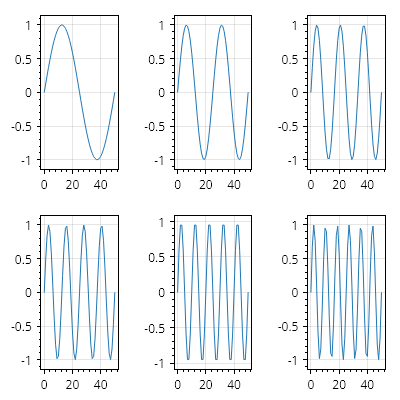
ScottPlot.Multiplot multiplot = new();

// 6 つのサブプロットを持つように multiplot を設定する
multiplot.AddPlots(6);

// 各サブプロットにサンプルデータを追加する
for (int i = 0; i < multiplot.Subplots.Count; i++)
{
    Plot plot = multiplot.GetPlot(i);
    double[] ys = Generate.Sin(oscillations: i + 1);
    plot.Add.Signal(ys);
}

// グリッドレイアウトを使用するように multiplot を設定する
multiplot.Layout = new ScottPlot.MultiplotLayouts.Grid(rows: 2, columns: 3);

multiplot.SavePng("demo.png", 400, 400);
Multiplot のカスタムレイアウト
Multiplot のカスタムレイアウト
Multiplot の Layout プロパティは、完全にカスタムなレイアウトを実現するように設定できます。
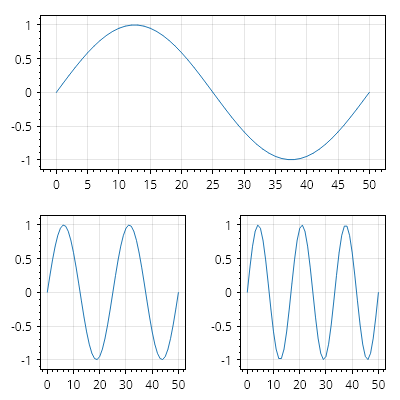
ScottPlot.Multiplot multiplot = new();

// multiplot が 3 つのサブプロットを持つように設定する
multiplot.AddPlots(3);

// 各サブプロットにサンプルデータを追加する
for (int i = 0; i < multiplot.Subplots.Count; i++)
{
    Plot plot = multiplot.GetPlot(i);
    double[] ys = Generate.Sin(oscillations: i + 1);
    plot.Add.Signal(ys);
}

// カスタムグリッドレイアウトを作成し、各サブプロットの位置を定義する
ScottPlot.MultiplotLayouts.CustomGrid gridLayout = new();
gridLayout.Set(multiplot.GetPlot(0), new GridCell(0, 0, 2, 1)); // 横幅 2 倍
gridLayout.Set(multiplot.GetPlot(1), new GridCell(1, 0, 2, 2)); // 左下
gridLayout.Set(multiplot.GetPlot(2), new GridCell(1, 1, 2, 2)); // 右下

// multiplot でカスタムレイアウトを使用する
multiplot.Layout = gridLayout;

multiplot.SavePng("demo.png", 400, 400);
回帰
Statistical operations to fit lines to data
レシピ
線形回帰
線形回帰
X/Y データ点の集合に直線を当てはめます。
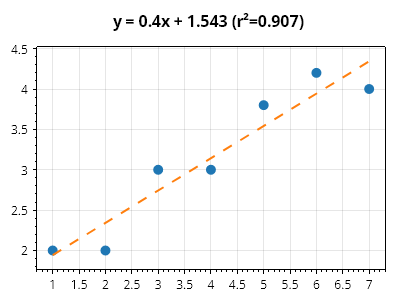
ScottPlot.Plot myPlot = new();

double[] xs = new double[] { 1, 2, 3, 4, 5, 6, 7 };
double[] ys = new double[] { 2, 2, 3, 3, 3.8, 4.2, 4 };

// 元のデータを散布図としてプロットする
var sp = myPlot.Add.Scatter(xs, ys);
sp.LineWidth = 0;
sp.MarkerSize = 10;

// 回帰直線を計算する
ScottPlot.Statistics.LinearRegression reg = new(xs, ys);

// 回帰直線をプロットする
Coordinates pt1 = new(xs.First(), reg.GetValue(xs.First()));
Coordinates pt2 = new(xs.Last(), reg.GetValue(xs.Last()));
var line = myPlot.Add.Line(pt1, pt2);
line.MarkerSize = 0;
line.LineWidth = 2;
line.LinePattern = LinePattern.Dashed;

// プロットの上部に数式を表示する
myPlot.Title(reg.FormulaWithRSquared);

myPlot.SavePng("demo.png", 400, 300);
クイックスタート
A survey of basic functionality in ScottPlot 5
レシピ
散布図
散布図
散布図は、X/Y データポイントを表示するために使用できます。
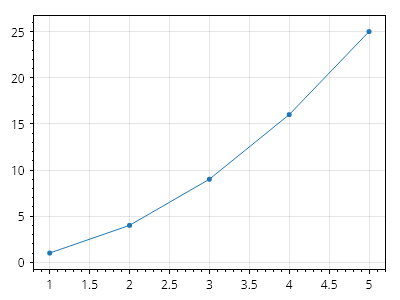
ScottPlot.Plot myPlot = new();

// サンプルデータを作成する
double[] dataX = { 1, 2, 3, 4, 5 };
double[] dataY = { 1, 4, 9, 16, 25 };

// プロットに散布図を追加する
myPlot.Add.Scatter(dataX, dataY);

myPlot.SavePng("demo.png", 400, 300);
Plottable のカスタマイズ
Plottable のカスタマイズ
プロットに項目を追加するほとんどのメソッドは、追加された項目を返します。返されたオブジェクトを保存し、そのプロパティを設定してカスタマイズします。
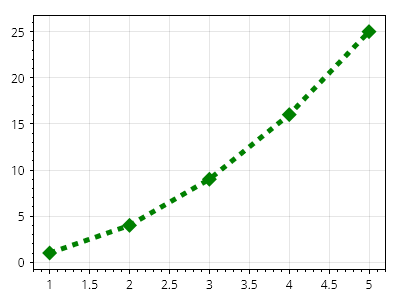
ScottPlot.Plot myPlot = new();

// サンプルデータを作成する
double[] dataX = { 1, 2, 3, 4, 5 };
double[] dataY = { 1, 4, 9, 16, 25 };

// プロットに散布図を追加する(そして返されたものを保存する)
var myScatter = myPlot.Add.Scatter(dataX, dataY);

// 散布図をカスタマイズする
myScatter.Color = Colors.Green;
myScatter.LineWidth = 5;
myScatter.MarkerSize = 15;
myScatter.MarkerShape = MarkerShape.FilledDiamond;
myScatter.LinePattern = LinePattern.DenselyDashed;

myPlot.SavePng("demo.png", 400, 300);
シグナルプロット
シグナルプロット
シグナルプロットは、等間隔の X 位置に Y 値を表示します。可能な限り、散布図の代わりにシグナルプロットを使用するべきです。
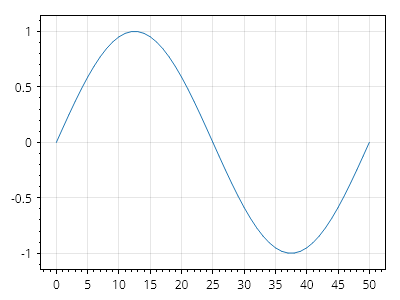
ScottPlot.Plot myPlot = new();

// サンプルデータを作成する
double[] sin = Generate.Sin(51);

// プロットにシグナルプロットを追加する
myPlot.Add.Signal(sin);

myPlot.SavePng("demo.png", 400, 300);
シグナルプロットのパフォーマンス
シグナルプロットのパフォーマンス
シグナルプロットは非常に高性能で、数百万個のデータポイントをリアルタイムでインタラクティブに表示できます。
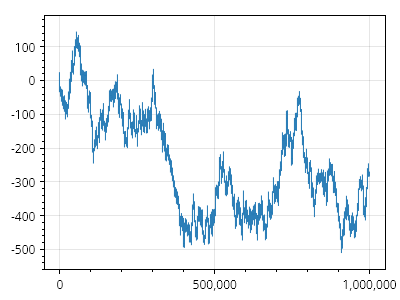
ScottPlot.Plot myPlot = new();

// 100万ポイントのサンプルデータを作成する
double[] data = Generate.RandomWalk(1_000_000);

// プロットにシグナルプロットを追加する
myPlot.Add.Signal(data);

myPlot.SavePng("demo.png", 400, 300);
軸ラベル
軸ラベル
プロットには、軸ラベルをすばやく設定するためのヘルパーメソッドがあります。追加の軸カスタマイズオプションについては、他のクックブックページを参照してください。
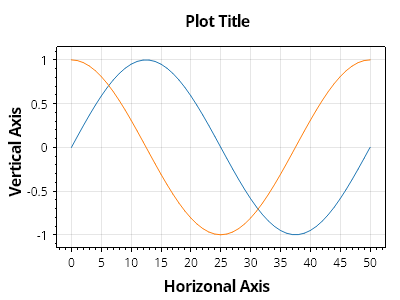
ScottPlot.Plot myPlot = new();

// サンプルデータをプロットする
myPlot.Add.Signal(Generate.Sin(51));
myPlot.Add.Signal(Generate.Cos(51));

// 軸ラベルをカスタマイズする
myPlot.XLabel("水平軸");
myPlot.YLabel("垂直軸");
myPlot.Title("プロットのタイトル");

myPlot.SavePng("demo.png", 400, 300);
アノテーション
Annotations are always-visible text labels positioned over the data area.
レシピ
アノテーションのクイックスタート
アノテーションのクイックスタート
アノテーションは、プロットのデータ領域上に配置できるラベルです。プロットに追加した Text は軸上の座標単位で配置されるのに対し、アノテーションはデータ領域に対して相対的に(ピクセル単位で)配置され、プロットをパンやズームしても移動しません。
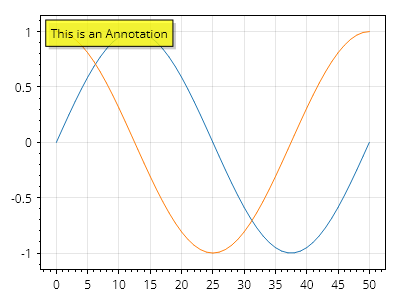
ScottPlot.Plot myPlot = new();

myPlot.Add.Signal(Generate.Sin());
myPlot.Add.Signal(Generate.Cos());

myPlot.Add.Annotation("This is an Annotation");

myPlot.SavePng("demo.png", 400, 300);
アノテーションのカスタマイズ
アノテーションのカスタマイズ
アノテーションは幅広くカスタマイズできます。
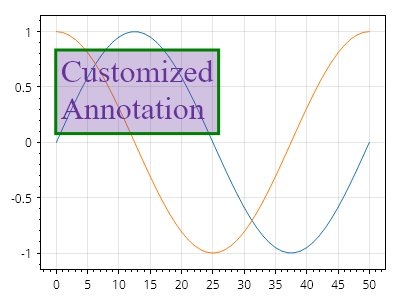
ScottPlot.Plot myPlot = new();

myPlot.Add.Signal(Generate.Sin());
myPlot.Add.Signal(Generate.Cos());

var anno = myPlot.Add.Annotation("Customized\nAnnotation");
anno.LabelFontSize = 32;
anno.LabelFontName = Fonts.Serif;
anno.LabelBackgroundColor = Colors.RebeccaPurple.WithAlpha(.3);
anno.LabelFontColor = Colors.RebeccaPurple;
anno.LabelBorderColor = Colors.Green;
anno.LabelBorderWidth = 3;
anno.LabelShadowColor = Colors.Transparent;
anno.OffsetY = 40;
anno.OffsetX = 20;

myPlot.SavePng("demo.png", 400, 300);
アノテーションの位置
アノテーションの位置
アノテーションはデータ領域に合わせて配置されます。
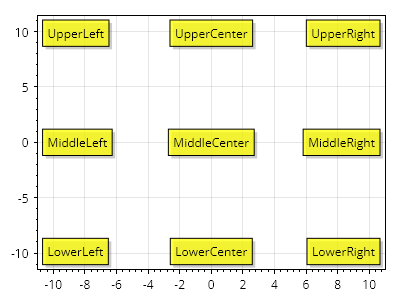
ScottPlot.Plot myPlot = new();

foreach (Alignment alignment in Enum.GetValues(typeof(Alignment)))
{
    myPlot.Add.Annotation(alignment.ToString(), alignment);
}

myPlot.SavePng("demo.png", 400, 300);
矢印
Arrows point to a location in coordinate space.
レシピ
矢印のクイックスタート
矢印のクイックスタート
矢印は、座標空間内の位置を指すためにプロットに配置でき、幅広くカスタマイズできます。
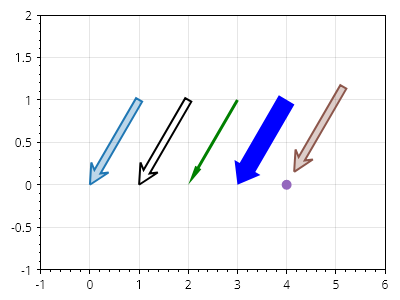
ScottPlot.Plot myPlot = new();

// create a line
Coordinates arrowTip = new(0, 0);
Coordinates arrowBase = new(1, 1);
CoordinateLine arrowLine = new(arrowBase, arrowTip);

// add a simple arrow
myPlot.Add.Arrow(arrowLine);

// arrow line and fill styles can be customized
var arrow2 = myPlot.Add.Arrow(arrowLine.WithDelta(1, 0));
arrow2.ArrowLineColor = Colors.Red;
arrow2.ArrowMinimumLength = 100;
arrow2.ArrowLineColor = Colors.Black;
arrow2.ArrowFillColor = Colors.Transparent;

// the shape of the arrowhead can be adjusted
var skinny = myPlot.Add.Arrow(arrowLine.WithDelta(2, 0));
skinny.ArrowFillColor = Colors.Green;
skinny.ArrowLineWidth = 0;
skinny.ArrowWidth = 3;
skinny.ArrowheadLength = 20;
skinny.ArrowheadAxisLength = 20;
skinny.ArrowheadWidth = 7;

var fat = myPlot.Add.Arrow(arrowLine.WithDelta(3, 0));
fat.ArrowFillColor = Colors.Blue;
fat.ArrowLineWidth = 0;
fat.ArrowWidth = 18;
fat.ArrowheadLength = 20;
fat.ArrowheadAxisLength = 20;
fat.ArrowheadWidth = 30;

// offset backs the arrow away from the tip coordinate
myPlot.Add.Marker(arrowLine.WithDelta(4, 0).End);
var arrow4 = myPlot.Add.Arrow(arrowLine.WithDelta(4, 0));
arrow4.ArrowOffset = 15;

myPlot.Axes.SetLimits(-1, 6, -1, 2);

myPlot.SavePng("demo.png", 400, 300);
軸線
Axis lines indicate a position on an axis.
レシピ
軸線
軸線
軸線は、軸全体にまたがる垂直線または水平線です。
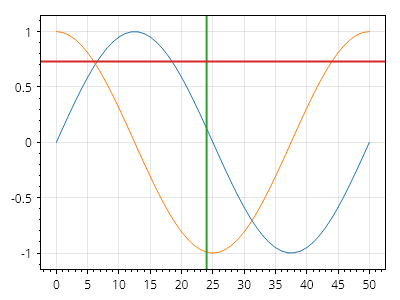
ScottPlot.Plot myPlot = new();

myPlot.Add.Signal(Generate.Sin());
myPlot.Add.Signal(Generate.Cos());

myPlot.Add.VerticalLine(24);
myPlot.Add.HorizontalLine(0.73);

myPlot.SavePng("demo.png", 400, 300);
軸線ラベル
軸線ラベル
軸線には、取り付けられている軸上に任意のテキストを表示するために使用できるラベルがあります。
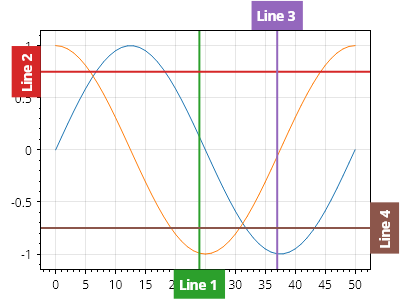
ScottPlot.Plot myPlot = new();

myPlot.Add.Signal(Generate.Sin());
myPlot.Add.Signal(Generate.Cos());

// デフォルトでは、ラベルは軸ラベルと同じ側に描画されます

var axLine1 = myPlot.Add.VerticalLine(24);
axLine1.Text = "線 1";

var axLine2 = myPlot.Add.HorizontalLine(0.75);
axLine2.Text = "線 2";

// ラベルは軸ラベルとは反対側に描画できます

var axLine3 = myPlot.Add.VerticalLine(37);
axLine3.Text = "線 3";
axLine3.LabelOppositeAxis = true;

var axLine4 = myPlot.Add.HorizontalLine(-.75);
axLine4.Text = "線 4";
axLine4.LabelOppositeAxis = true;

// 右側と上側に余分なパディングを設けることで、ラベル用のスペースを確保します
myPlot.Axes.Right.MinimumSize = 30;
myPlot.Axes.Top.MinimumSize = 30;

myPlot.SavePng("demo.png", 400, 300);
軸線ラベルの配置
軸線ラベルの配置
軸線ラベルには、回転や配置を含むカスタム配置を設定できます。
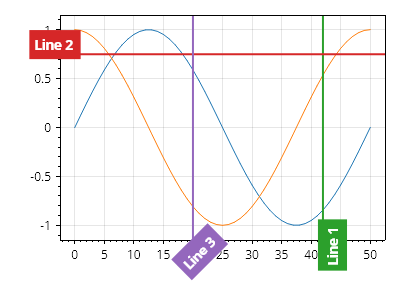
ScottPlot.Plot myPlot = new();

myPlot.Add.Signal(Generate.Sin());
myPlot.Add.Signal(Generate.Cos());

var axLine1 = myPlot.Add.VerticalLine(42);
axLine1.Text = "線 1";
axLine1.LabelRotation = -90;
axLine1.LabelAlignment = Alignment.MiddleRight;

var axLine2 = myPlot.Add.HorizontalLine(0.75);
axLine2.Text = "線 2";
axLine2.LabelRotation = 0;
axLine2.LabelAlignment = Alignment.MiddleRight;

var axLine3 = myPlot.Add.VerticalLine(20);
axLine3.Text = "線 3";
axLine3.LabelRotation = -45;
axLine3.LabelAlignment = Alignment.UpperRight;

// 回転したラベルのために下と左に余分な余白を追加する
myPlot.Axes.Bottom.MinimumSize = 60;
myPlot.Axes.Left.MinimumSize = 60;

myPlot.SavePng("demo.png", 400, 300);
軸線のスタイル
軸線のスタイル
軸線には広範なカスタマイズオプションがあります。
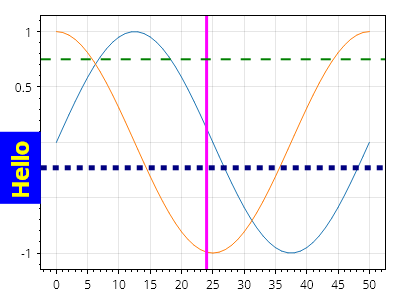
ScottPlot.Plot myPlot = new();

myPlot.Add.Signal(Generate.Sin());
myPlot.Add.Signal(Generate.Cos());

var vl1 = myPlot.Add.VerticalLine(24);
vl1.LineWidth = 3;
vl1.Color = Colors.Magenta;

var hl1 = myPlot.Add.HorizontalLine(0.75);
hl1.LineWidth = 2;
hl1.Color = Colors.Green;
hl1.LinePattern = LinePattern.Dashed;

var hl2 = myPlot.Add.HorizontalLine(-.23);
hl2.LineColor = Colors.Navy;
hl2.LineWidth = 5;
hl2.Text = "こんにちは";
hl2.LabelFontSize = 24;
hl2.LabelBackgroundColor = Colors.Blue;
hl2.LabelFontColor = Colors.Yellow;
hl2.LinePattern = LinePattern.DenselyDashed;

myPlot.SavePng("demo.png", 400, 300);
凡例内の軸線
凡例内の軸線
軸線は、ExcludeFromLegend プロパティが true でない限り、Text プロパティが設定されている場合に凡例へ追加されます。
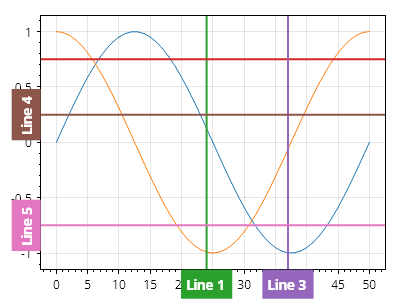
ScottPlot.Plot myPlot = new();

myPlot.Add.Signal(Generate.Sin());
myPlot.Add.Signal(Generate.Cos());

var axLine1 = myPlot.Add.VerticalLine(24);
axLine1.Text = "線 1";

var axLine2 = myPlot.Add.HorizontalLine(0.75);

var axLine3 = myPlot.Add.VerticalLine(37);
axLine3.Text = "線 3";
axLine3.ExcludeFromLegend = true;

var axLine4 = myPlot.Add.HorizontalLine(0.25);
axLine4.Text = "線 4";

var axLine5 = myPlot.Add.HorizontalLine(-.75);
axLine5.Text = "線 5";
axLine5.ExcludeFromLegend = true;

myPlot.ShowLegend();

myPlot.SavePng("demo.png", 400, 300);
自動スケール時に無視
自動スケール時に無視
Plot.Axes.AutoScale() を呼び出すか、プロットを中クリックすると、データに合わせて軸の範囲が設定されます。デフォルトでは、軸線とスパンの位置は自動軸範囲計算に含まれますが、フラグを設定することで、プロットの自動スケール時に特定のプロット可能オブジェクトを無視できます。
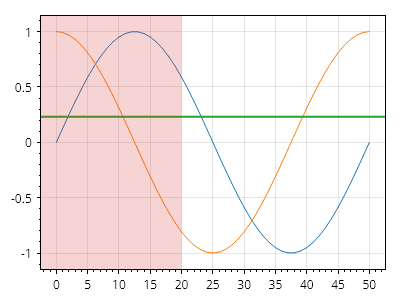
ScottPlot.Plot myPlot = new();

myPlot.Add.Signal(Generate.Sin(51));
myPlot.Add.Signal(Generate.Cos(51));

var hline = myPlot.Add.HorizontalLine(0.23);
hline.IsDraggable = true;
hline.EnableAutoscale = false;

var hSpan = myPlot.Add.HorizontalSpan(-10, 20);
hSpan.IsDraggable = true;
hSpan.EnableAutoscale = false;

myPlot.SavePng("demo.png", 400, 300);
制限付きの軸線
制限付きの軸線
軸線はデフォルトでは両方向に無限に延びますが、軸線の寸法を制限するために上限と下限を指定できます。
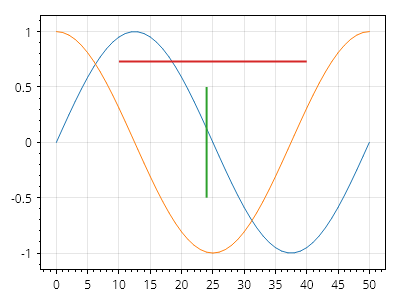
ScottPlot.Plot myPlot = new();

myPlot.Add.Signal(Generate.Sin());
myPlot.Add.Signal(Generate.Cos());

var vLine = myPlot.Add.VerticalLine(24);
vLine.Minimum = -.5;
vLine.Maximum = 0.5;

var hLine = myPlot.Add.HorizontalLine(0.73);
hLine.Minimum = 10;
hLine.Maximum = 40;

myPlot.SavePng("demo.png", 400, 300);
軸スパン
Axis spans indicate a range of an axis.
レシピ
軸スパンのクイックスタート
軸スパンのクイックスタート
軸スパンは、軸の範囲にラベルを付けます。垂直スパンは垂直方向の範囲の全幅を塗りつぶし、水平スパンは水平方向の範囲の全高を塗りつぶします。
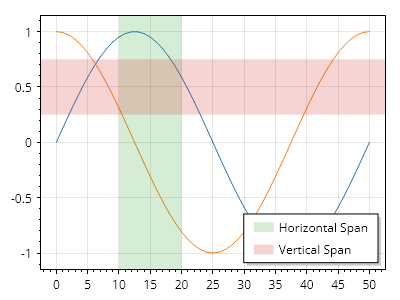
ScottPlot.Plot myPlot = new();

myPlot.Add.Signal(Generate.Sin());
myPlot.Add.Signal(Generate.Cos());

var hSpan = myPlot.Add.HorizontalSpan(10, 20);
var vSpan = myPlot.Add.VerticalSpan(0.25, 0.75);

hSpan.LegendText = "水平スパン";
vSpan.LegendText = "垂直スパン";
myPlot.ShowLegend();

myPlot.SavePng("demo.png", 400, 300);
軸スパンのスタイリング
軸スパンのスタイリング
軸スパンは広範囲にカスタマイズできます。
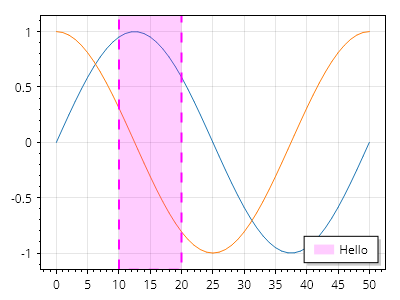
ScottPlot.Plot myPlot = new();

myPlot.Add.Signal(Generate.Sin());
myPlot.Add.Signal(Generate.Cos());

var hs = myPlot.Add.HorizontalSpan(10, 20);
hs.LegendText = "こんにちは";
hs.LineStyle.Width = 2;
hs.LineStyle.Color = Colors.Magenta;
hs.LineStyle.Pattern = LinePattern.Dashed;
hs.FillStyle.Color = Colors.Magenta.WithAlpha(.2);

myPlot.SavePng("demo.png", 400, 300);
棒グラフ
Bar plots represent values as horizontal or vertical rectangles
レシピ
- 棒グラフクイックスタート
- 棒グラフの凡例
- 値ラベル付きの棒グラフ
- 値ラベル付きの棒グラフ(水平)
- 上部のラベル
- 棒の配置
- エラー付き棒
- ラベル付き目盛りの棒グラフ
- バーの塗りつぶしスタイル
- カスタマイズされた棒グラフ
- 積み上げ棒グラフ
- グループ化棒グラフ
- 水平棒グラフ
- 積み上げ棒グラフ
- カスタムテキスト付きの棒
- 範囲チャート
- 水平レンジチャート
- 積み上げレンジチャート
- 積み上げ水平レンジチャート
棒グラフクイックスタート
棒グラフクイックスタート
棒グラフは、一連の値から追加できます。
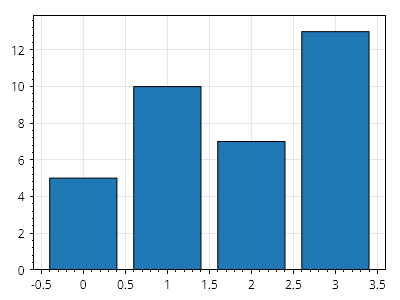
ScottPlot.Plot myPlot = new();

// 棒を追加する
double[] values = { 5, 10, 7, 13 };
myPlot.Add.Bars(values);

// 棒の下に余白を設けずにプロットを自動スケールする
myPlot.Axes.Margins(bottom: 0);

myPlot.SavePng("demo.png", 400, 300);
棒グラフの凡例
棒グラフの凡例
棒のコレクションは、単一の項目として凡例に表示できます。
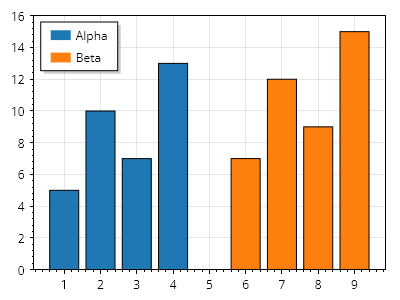
ScottPlot.Plot myPlot = new();

double[] xs1 = { 1, 2, 3, 4 };
double[] ys1 = { 5, 10, 7, 13 };
var bars1 = myPlot.Add.Bars(xs1, ys1);
bars1.LegendText = "Alpha";

double[] xs2 = { 6, 7, 8, 9 };
double[] ys2 = { 7, 12, 9, 15 };
var bars2 = myPlot.Add.Bars(xs2, ys2);
bars2.LegendText = "Beta";

myPlot.ShowLegend(Alignment.UpperLeft);
myPlot.Axes.Margins(bottom: 0);

myPlot.SavePng("demo.png", 400, 300);
値ラベル付きの棒グラフ
値ラベル付きの棒グラフ
棒の Label プロパティを設定すると、各棒の上にテキストを表示できます。
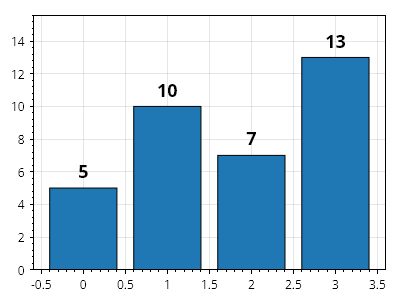
ScottPlot.Plot myPlot = new();

double[] values = { 5, 10, 7, 13 };
var barPlot = myPlot.Add.Bars(values);

// ラベルの内容を定義する
foreach (var bar in barPlot.Bars)
{
    bar.Label = bar.Value.ToString();
}

// ラベルのスタイルをカスタマイズする
barPlot.ValueLabelStyle.Bold = true;
barPlot.ValueLabelStyle.FontSize = 18;

myPlot.Axes.Margins(bottom: 0, top: .2);

myPlot.SavePng("demo.png", 400, 300);
値ラベル付きの棒グラフ(水平)
値ラベル付きの棒グラフ(水平)
各棒の横(左または右)にテキストを表示するには、棒の Label プロパティを設定します。
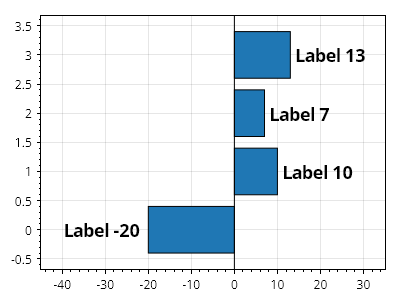
ScottPlot.Plot myPlot = new();

double[] values = { -20, 10, 7, 13 };

// 各棒のラベルを設定する
var barPlot = myPlot.Add.Bars(values);
foreach (var bar in barPlot.Bars)
{
    bar.Label = "ラベル " + bar.Value.ToString();
}

// ラベルのスタイルをカスタマイズする
barPlot.ValueLabelStyle.Bold = true;
barPlot.ValueLabelStyle.FontSize = 18;
barPlot.Horizontal = true;

// ラベルを考慮して余白を追加する
myPlot.Axes.SetLimitsX(-45, 35);
myPlot.Add.VerticalLine(0, 1, Colors.Black);

myPlot.SavePng("demo.png", 400, 300);
上部のラベル
上部のラベル
ラベル付きの棒はデフォルトでは1つずつレンダリングされますが、これにより棒のラベルが他の棒と重なる可能性があります。棒グラフは、他のプロット可能オブジェクトの上であっても、ラベルを最後にレンダリングするように設定できます。
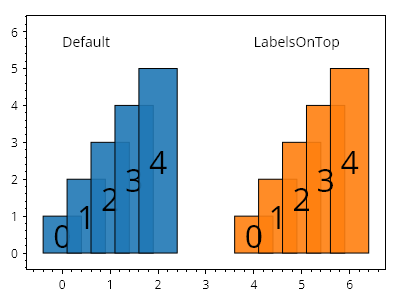
ScottPlot.Plot myPlot = new();

double[] values = Generate.Consecutive(5, first: 1);

// 2つの棒プロットを作成する
var bars1 = myPlot.Add.Bars(values);
var bars2 = myPlot.Add.Bars(values);

// いずれかの棒で LabelsOnTop 機能を有効にする
bars2.LabelsOnTop = true;

// 効果を示すために各棒にラベルを付けてスタイルを設定する
static void StyleBar(ScottPlot.Plottables.BarPlot barPlot, double xOffset)
{
    barPlot.ValueLabelStyle.FontSize = 32;
    for (int i = 0; i < barPlot.Bars.Count; i++)
    {
        var bar = barPlot.Bars[i];
        bar.Label = i.ToString();
        bar.CenterLabel = true;
        bar.Position = i * .5 + xOffset;
        bar.FillColor = bar.FillColor.WithAlpha(.9);
    }
}

StyleBar(bars1, 0);
StyleBar(bars2, 4);

myPlot.Add.Text("デフォルト", 0, 6);
myPlot.Add.Text("LabelsOnTop", 4, 6);

myPlot.HideGrid();

myPlot.SavePng("demo.png", 400, 300);
棒の配置
棒の配置
各棒の正確な位置とサイズはカスタマイズできます。
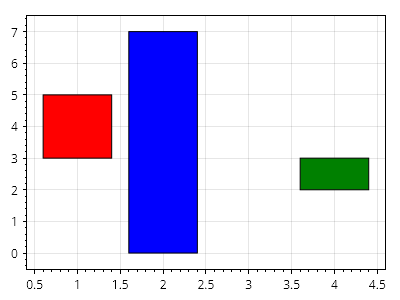
ScottPlot.Plot myPlot = new();

ScottPlot.Bar[] bars =
{
    new() { Position = 1, Value = 5, ValueBase = 3, FillColor = Colors.Red },
    new() { Position = 2, Value = 7, ValueBase = 0, FillColor = Colors.Blue },
    new() { Position = 4, Value = 3, ValueBase = 2, FillColor = Colors.Green },
};

myPlot.Add.Bars(bars);

myPlot.SavePng("demo.png", 400, 300);
エラー付き棒
エラー付き棒
棒にはエラーバーを付けることができます。
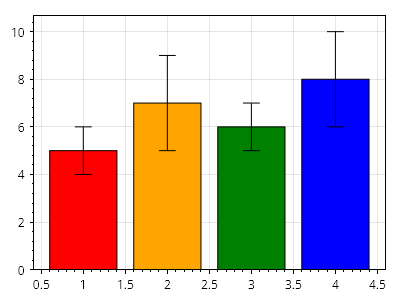
ScottPlot.Plot myPlot = new();

ScottPlot.Bar[] bars =
{
    new() { Position = 1, Value = 5, Error = 1, FillColor = Colors.Red },
    new() { Position = 2, Value = 7, Error = 2, FillColor = Colors.Orange },
    new() { Position = 3, Value = 6, Error = 1, FillColor = Colors.Green },
    new() { Position = 4, Value = 8, Error = 2, FillColor = Colors.Blue },
};

myPlot.Add.Bars(bars);

// 棒の下にパディングを入れずに自動スケーリングするようプロットに指示します
myPlot.Axes.Margins(bottom: 0);

myPlot.SavePng("demo.png", 400, 300);
ラベル付き目盛りの棒グラフ
ラベル付き目盛りの棒グラフ
棒グラフは、軸の目盛り位置とラベルを手動で指定することでラベル付けできます。
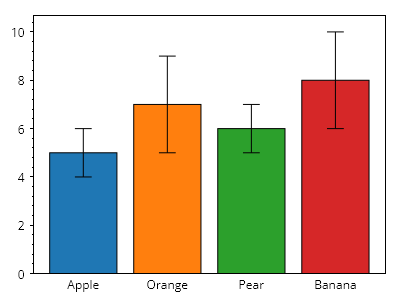
ScottPlot.Plot myPlot = new();

myPlot.Add.Bar(position: 1, value: 5, error: 1);
myPlot.Add.Bar(position: 2, value: 7, error: 2);
myPlot.Add.Bar(position: 3, value: 6, error: 1);
myPlot.Add.Bar(position: 4, value: 8, error: 2);

Tick[] ticks =
{
    new(1, "Apple"),
    new(2, "Orange"),
    new(3, "Pear"),
    new(4, "Banana"),
};

myPlot.Axes.Bottom.TickGenerator = new ScottPlot.TickGenerators.NumericManual(ticks);
myPlot.Axes.Bottom.MajorTickStyle.Length = 0;
myPlot.HideGrid();

// 棒の下に余白を設けずにプロットを自動スケールするよう指示する
myPlot.Axes.Margins(bottom: 0);

myPlot.SavePng("demo.png", 400, 300);
バーの塗りつぶしスタイル
バーの塗りつぶしスタイル
各バーは個別にスタイル設定できます。
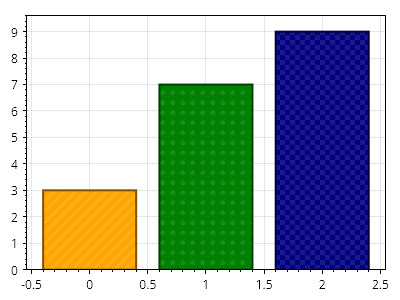
ScottPlot.Plot myPlot = new();

// サンプルデータでバーを追加する
double[] values = { 3, 7, 9 };
var barPlot = myPlot.Add.Bars(values);

// バーは追加後にスタイル設定できる
barPlot.Bars[0].FillColor = Colors.Orange;
barPlot.Bars[1].FillColor = Colors.Green;
barPlot.Bars[2].FillColor = Colors.Navy;

barPlot.Bars[0].FillHatch = new ScottPlot.Hatches.Striped();
barPlot.Bars[1].FillHatch = new ScottPlot.Hatches.Dots();
barPlot.Bars[2].FillHatch = new ScottPlot.Hatches.Checker();

foreach (var bar in barPlot.Bars)
{
    bar.LineWidth = 2;
    bar.LineColor = bar.FillColor.Darken(0.5);
    bar.FillHatchColor = bar.FillColor.Lighten(0.1);
}

// バーの下に余白がないようにプロットを自動スケーリングする
myPlot.Axes.Margins(bottom: 0);

myPlot.SavePng("demo.png", 400, 300);
カスタマイズされた棒グラフ
カスタマイズされた棒グラフ
棒グラフのスタイル設定と配置を究極的に制御するには、各棒を個別に作成し、必要に応じてスタイルを設定し、その正確なサイズと位置を設定します。このレベルのカスタマイズを使用して、非常に高度な積み上げ棒グラフやグループ化棒グラフを作成できます。
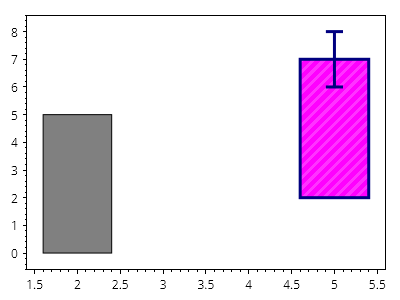
ScottPlot.Plot myPlot = new();

ScottPlot.Bar bar1 = new()
{
    Position = 2,
    Value = 5,
};

myPlot.Add.Bar(bar1);

ScottPlot.Bar bar2 = new()
{
    Position = 5,
    Value = 7,
    ValueBase = 2,
    Error = 1,
    FillColor = Colors.Magenta,
    LineWidth = 3,
    LineColor = Colors.Navy,
    FillHatch = new ScottPlot.Hatches.Striped(),
    FillHatchColor = Colors.Magenta.Lighten(.2),
};

myPlot.Add.Bar(bar2);

myPlot.HideGrid();

myPlot.SavePng("demo.png", 400, 300);
積み上げ棒グラフ
積み上げ棒グラフ
棒は互いの上に配置できます。
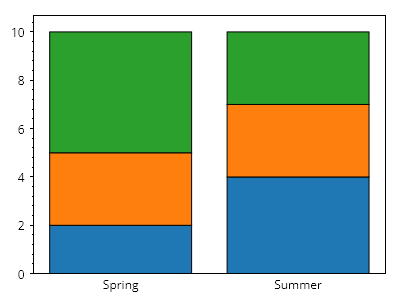
ScottPlot.Plot myPlot = new();

ScottPlot.Palettes.Category10 palette = new();

ScottPlot.Bar[] bars =
{
    // 積み上げ棒の最初のセット
    new() { Position = 1, ValueBase = 0, Value = 2, FillColor = palette.GetColor(0) },
    new() { Position = 1, ValueBase = 2, Value = 5, FillColor = palette.GetColor(1) },
    new() { Position = 1, ValueBase = 5, Value = 10, FillColor = palette.GetColor(2) },

    // 積み上げ棒の2番目のセット
    new() { Position = 2, ValueBase = 0, Value = 4, FillColor = palette.GetColor(0) },
    new() { Position = 2, ValueBase = 4, Value = 7, FillColor = palette.GetColor(1) },
    new() { Position = 2, ValueBase = 7, Value = 10, FillColor = palette.GetColor(2) },
};

myPlot.Add.Bars(bars);

Tick[] ticks =
{
    new(1, "春"),
    new(2, "夏"),
};

myPlot.Axes.Bottom.TickGenerator = new ScottPlot.TickGenerators.NumericManual(ticks);
myPlot.Axes.Bottom.MajorTickStyle.Length = 0;
myPlot.HideGrid();

// 棒の下に余白がないようにプロットを自動スケールする
myPlot.Axes.Margins(bottom: 0);

myPlot.SavePng("demo.png", 400, 300);
グループ化棒グラフ
グループ化棒グラフ
棒は位置と色でグループ化できます。
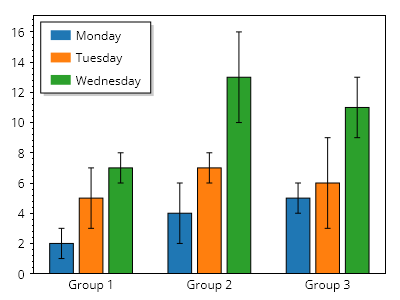
ScottPlot.Plot myPlot = new();

ScottPlot.Palettes.Category10 palette = new();

ScottPlot.Bar[] bars =
{
    // 1つ目のグループ
    new() { Position = 1, Value = 2, FillColor = palette.GetColor(0), Error = 1 },
    new() { Position = 2, Value = 5, FillColor = palette.GetColor(1), Error = 2 },
    new() { Position = 3, Value = 7, FillColor = palette.GetColor(2), Error = 1 },

    // 2つ目のグループ
    new() { Position = 5, Value = 4, FillColor = palette.GetColor(0), Error = 2 },
    new() { Position = 6, Value = 7, FillColor = palette.GetColor(1), Error = 1 },
    new() { Position = 7, Value = 13, FillColor = palette.GetColor(2), Error = 3 },

    // 3つ目のグループ
    new() { Position = 9, Value = 5, FillColor = palette.GetColor(0), Error = 1 },
    new() { Position = 10, Value = 6, FillColor = palette.GetColor(1), Error = 3 },
    new() { Position = 11, Value = 11, FillColor = palette.GetColor(2), Error = 2 },
};

myPlot.Add.Bars(bars);

// 凡例を手動で構築する
myPlot.Legend.IsVisible = true;
myPlot.Legend.Alignment = Alignment.UpperLeft;
myPlot.Legend.ManualItems.Add(new() { LabelText = "月曜日", FillColor = palette.GetColor(0) });
myPlot.Legend.ManualItems.Add(new() { LabelText = "火曜日", FillColor = palette.GetColor(1) });
myPlot.Legend.ManualItems.Add(new() { LabelText = "水曜日", FillColor = palette.GetColor(2) });

// 下軸にグループラベルを表示する
Tick[] ticks =
{
    new(2, "グループ 1"),
    new(6, "グループ 2"),
    new(10, "グループ 3"),
};
myPlot.Axes.Bottom.TickGenerator = new ScottPlot.TickGenerators.NumericManual(ticks);
myPlot.Axes.Bottom.MajorTickStyle.Length = 0;
myPlot.HideGrid();

// 棒の下に余白を入れずに自動スケールするようプロットに指示する
myPlot.Axes.Margins(bottom: 0);

myPlot.SavePng("demo.png", 400, 300);
水平棒グラフ
水平棒グラフ
棒グラフは水平方向に表示できます。
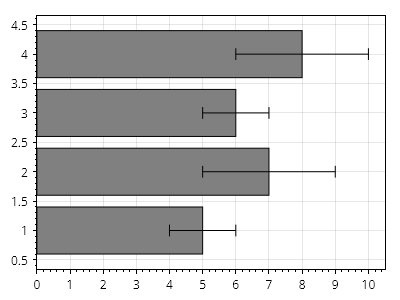
ScottPlot.Plot myPlot = new();

ScottPlot.Bar[] bars =
{
    new() { Position = 1, Value = 5, Error = 1, },
    new() { Position = 2, Value = 7, Error = 2, },
    new() { Position = 3, Value = 6, Error = 1, },
    new() { Position = 4, Value = 8, Error = 2, },
};

var barPlot = myPlot.Add.Bars(bars);
barPlot.Horizontal = true;

myPlot.Axes.Margins(left: 0);

myPlot.SavePng("demo.png", 400, 300);
積み上げ棒グラフ
積み上げ棒グラフ
棒は、データをグループ単位で表すために積み上げることができます。
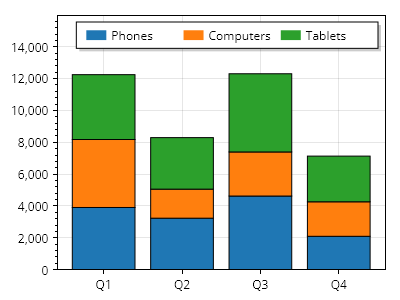
ScottPlot.Plot myPlot = new();

string[] categoryNames = { "電話", "コンピューター", "タブレット" };
Color[] categoryColors = { Colors.C0, Colors.C1, Colors.C2 };

for (int x = 0; x < 4; x++)
{
    double[] values = Generate.RandomSample(categoryNames.Length, 1000, 5000);

    double nextBarBase = 0;

    for (int i = 0; i < values.Length; i++)
    {
        ScottPlot.Bar bar = new()
        {
            Value = nextBarBase + values[i],
            FillColor = categoryColors[i],
            ValueBase = nextBarBase,
            Position = x,
        };

        myPlot.Add.Bar(bar);

        nextBarBase += values[i];
    }
}

// 下部にカスタム目盛りラベルを使用する
ScottPlot.TickGenerators.NumericManual tickGen = new();
for (int x = 0; x < 4; x++)
{
    tickGen.AddMajor(x, $"Q{x + 1}");
}
myPlot.Axes.Bottom.TickGenerator = tickGen;

// 凡例にグループを表示する
for (int i = 0; i < 3; i++)
{
    LegendItem item = new()
    {
        LabelText = categoryNames[i],
        FillColor = categoryColors[i]
    };
    myPlot.Legend.ManualItems.Add(item);
}
myPlot.Legend.Orientation = Orientation.Horizontal;
myPlot.ShowLegend(Alignment.UpperRight);

// 棒の下に余白を入れずに自動スケールするようプロットに指示する
myPlot.Axes.Margins(bottom: 0, top: .3);

myPlot.SavePng("demo.png", 400, 300);
カスタムテキスト付きの棒
カスタムテキスト付きの棒
棒の寸法に合わせて完全にカスタマイズ可能なテキストオブジェクトを棒の上に配置することで、棒ラベルを完全に制御できます。
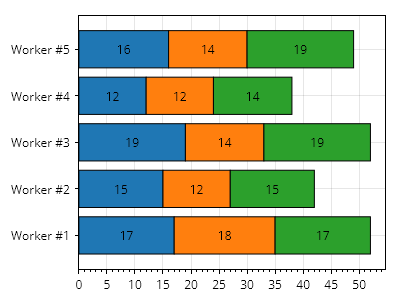
ScottPlot.Plot myPlot = new();

ScottPlot.Palettes.Category10 palette = new();

// 積み上げ棒のグループを5つ作成する
for (int i = 0; i < 5; i++)
{
    // 積み上げを伴う個別の棒を3つ作成する
    List<ScottPlot.Bar> bars = [];
    double valueBase = 0;
    for (int j = 0; j < 3; j++)
    {
        double barSize = Generate.RandomInteger(10, 20);
        ScottPlot.Bar bar1 = new()
        {
            FillColor = palette.GetColor(j),
            Position = i,
            ValueBase = valueBase,
            Value = valueBase + barSize,
            Label = $"{barSize}",
            CenterLabel = true,
        };

        bars.Add(bar1);
        valueBase += barSize;
    }

    // 積み上げ棒をプロットする
    var barPlot = myPlot.Add.Bars(bars);
    barPlot.Horizontal = true;
}

// 棒が左端から始まるようにプロットのスタイルを設定する
myPlot.Axes.Margins(left: 0);

// カスタムグループラベルを追加する
double[] tickPositions = Generate.Consecutive(5);
string[] tickLabels = Enumerable.Range(1, 5).Select(x => $"作業者 #{x}").ToArray();
myPlot.Axes.Left.SetTicks(tickPositions, tickLabels);

myPlot.SavePng("demo.png", 400, 300);
範囲チャート
範囲チャート
範囲チャートは、名前付きの値範囲の離散集合を表示します
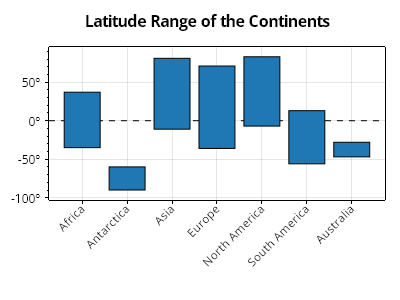
ScottPlot.Plot myPlot = new();

List<(string name, CoordinateRange range)> ranges =
[
    ("アフリカ", new(-35, 37)),
    ("南極大陸", new(-90, -60)),
    ("アジア", new(-11, 81)),
    ("ヨーロッパ", new(-36, 71)),
    ("北アメリカ", new(-7, 83)),
    ("南アメリカ", new(-56, 13)),
    ("オーストラリア", new(-47, -28)),
];
myPlot.Add.Ranges(ranges);

// 軸のスタイルを設定する
myPlot.Title("大陸の緯度範囲");
myPlot.Axes.Bottom.TickLabelStyle.Rotation = -45;
myPlot.Axes.Bottom.TickLabelStyle.Alignment = Alignment.MiddleRight;
myPlot.Axes.Bottom.MinimumSize = 100;

// 度記号付きの目盛りラベルを使用する
ScottPlot.TickGenerators.NumericAutomatic tickGen = new();
myPlot.Axes.Left.TickGenerator = tickGen;
tickGen.LabelFormatter = (x) => $"{x}º";

// 0 の位置に水平線を追加し、範囲プロットの背面へ移動する
var hl = myPlot.Add.HorizontalLine(0, 1, Colors.Black, LinePattern.DenselyDashed);
myPlot.MoveToBack(hl);

myPlot.SavePng("demo.png", 400, 300);
水平レンジチャート
水平レンジチャート
レンジチャートは、水平方向のバーを使用して作成できます
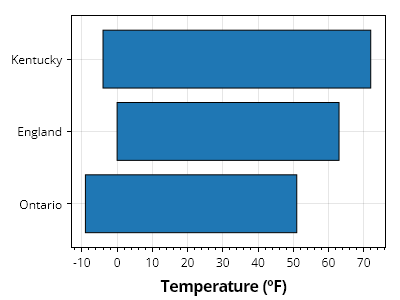
ScottPlot.Plot myPlot = new();

List<(string name, CoordinateRange range)> ranges =
[
    ("Ontario", new(-9, 51)),
    ("England", new(0, 63)),
    ("Kentucky", new(-4, 72)),
];

myPlot.Add.Ranges(ranges, horizontal: true);

myPlot.XLabel("気温 (ºF)");

myPlot.SavePng("demo.png", 400, 300);
積み上げレンジチャート
積み上げレンジチャート
積み上げレンジチャートは、離散的な項目の集合に対する複数の範囲を表します
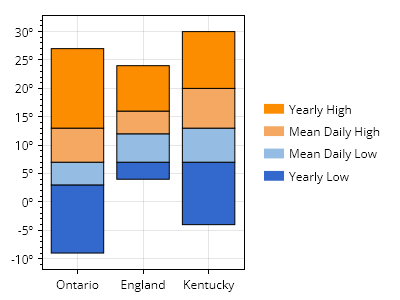
ScottPlot.Plot myPlot = new();

// カスタムカラーパレットを準備する
string[] colorCodes = ["#3369cc", "#95bce3", "#f4a861", "#fd8d00"];
ScottPlot.Palettes.Custom palette = new(colorCodes);

// 名前付き範囲のコレクションを使用して積み上げ棒グラフを作成する
string[] rangeNames = ["Yearly Low", "Mean Daily Low", "Mean Daily High", "Yearly High"];
List<(string name, double[] edges)> ranges =
[
    ("Ontario", [-9, 3, 7, 13, 27]),
    ("England", [4, 7, 12, 16, 24]),
    ("Kentucky", [-4, 7, 13, 20, 30]),
];
myPlot.Add.StackedRanges(ranges, palette);

// 度数記号付きの目盛ラベルを使用する
ScottPlot.TickGenerators.NumericAutomatic tickGen = new();
myPlot.Axes.Left.TickGenerator = tickGen;
tickGen.LabelFormatter = (x) => $"{x}º";

// データ領域の外側に凡例を表示する
myPlot.ShowLegend(Edge.Right);

// 凡例に項目を手動で追加する
for (int i = 0; i < rangeNames.Length; i++)
{
    LegendItem item = new()
    {
        LabelText = rangeNames[i],
        FillColor = palette.GetColor(i),
    };
    myPlot.Legend.ManualItems.Add(item);
}
myPlot.Legend.ManualItems.Reverse();

// スタイルと配置を改善する
myPlot.Legend.OutlineStyle.IsVisible = false;
myPlot.Legend.ShadowColor = Colors.Transparent;
myPlot.Legend.Padding = new(0);
myPlot.Axes.Right.MaximumSize = 0;

myPlot.SavePng("demo.png", 400, 300);
積み上げ水平レンジチャート
積み上げ水平レンジチャート
水平方向の積み上げレンジチャートを作成できます
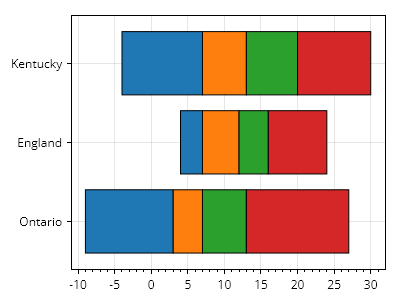
ScottPlot.Plot myPlot = new();

List<(string name, double[] edges)> ranges =
[
    ("Ontario", [-9, 3, 7, 13, 27]),
    ("England", [4, 7, 12, 16, 24]),
    ("Kentucky", [-4, 7, 13, 20, 30]),
];

myPlot.Add.StackedRanges(ranges, horizontal: true);

myPlot.SavePng("demo.png", 400, 300);
箱ひげ図
Box plots show a distribution at a glance
レシピ
箱ひげ図クイックスタート
箱ひげ図クイックスタート
箱ひげ図は個別に作成してプロットに追加できます。
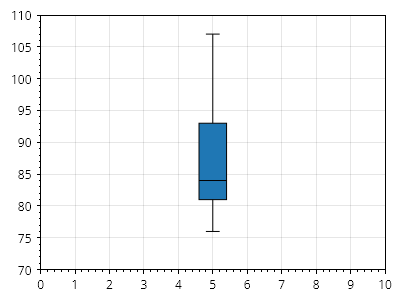
ScottPlot.Plot myPlot = new();

ScottPlot.Box box = new()
{
    Position = 5,
    BoxMin = 81,
    BoxMax = 93,
    WhiskerMin = 76,
    WhiskerMax = 107,
    BoxMiddle = 84,
};

myPlot.Add.Box(box);

myPlot.Axes.SetLimits(0, 10, 70, 110);

myPlot.SavePng("demo.png", 400, 300);
箱ひげ図のグループ
箱ひげ図のグループ
プロットに追加された箱の各コレクションは同じスタイルになり、凡例では単一の項目として表示されます。定義済みの X 位置を持つ複数の棒系列プロットを追加すると、グループ化されたデータのように見せることができます。
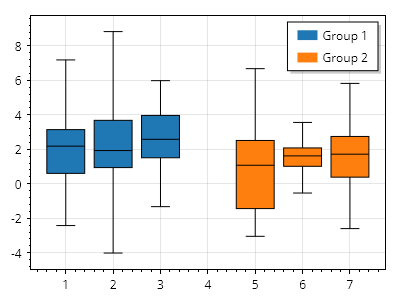
ScottPlot.Plot myPlot = new();

List<ScottPlot.Box> boxes1 = new() {
    Generate.RandomBox(1),
    Generate.RandomBox(2),
    Generate.RandomBox(3),
};

List<ScottPlot.Box> boxes2 = new() {
    Generate.RandomBox(5),
    Generate.RandomBox(6),
    Generate.RandomBox(7),
};

var bp1 = myPlot.Add.Boxes(boxes1);
bp1.LegendText = "グループ 1";

var bp2 = myPlot.Add.Boxes(boxes2);
bp2.LegendText = "グループ 2";

myPlot.ShowLegend(Alignment.UpperRight);

myPlot.SavePng("demo.png", 400, 300);
Bracket
Brackets annotate a range along a line in coordinate space
レシピ
Bracket
Bracket
ブラケットは、データの線形範囲に注釈を付けるのに便利です。
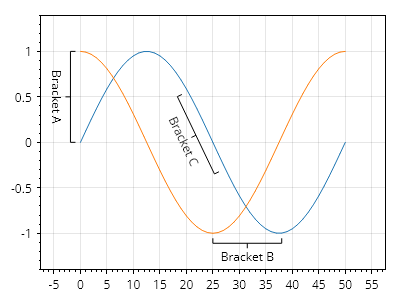
ScottPlot.Plot myPlot = new();

myPlot.Add.Signal(Generate.Sin());
myPlot.Add.Signal(Generate.Cos());

myPlot.Add.Bracket(0, 1, 0, 0, "Bracket A");
myPlot.Add.Bracket(25, -1, 38, -1, "Bracket B");
myPlot.Add.Bracket(20, .55, 27, -.3, "Bracket C");

myPlot.Axes.Margins(0.3, 0.4); // ラベル用の余分なスペース

myPlot.SavePng("demo.png", 400, 300);
コールアウト
Callouts display a label and are connected with an arrow that marks a point on the plot.
レシピ
Callout クイックスタート
Callout クイックスタート
Callout はラベルを表示し、プロット上の点を示す矢印で接続されます。
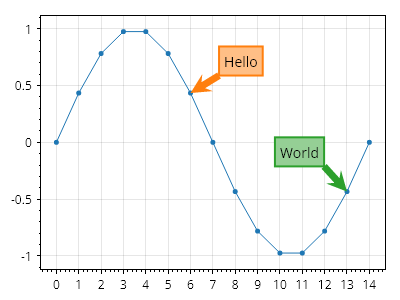
ScottPlot.Plot myPlot = new();

double[] xs = Generate.Consecutive(15);
double[] ys = Generate.Sin(15);
myPlot.Add.Scatter(xs, ys);

myPlot.Add.Callout("こんにちは",
    textLocation: new(7.5, .8),
    tipLocation: new(xs[6], ys[6]));

myPlot.Add.Callout("世界",
    textLocation: new(10, 0),
    tipLocation: new(xs[13], ys[13]));

myPlot.SavePng("demo.png", 400, 300);
等高線図
A contour plot is a graphical representation that shows the three-dimensional surface of a function on a two-dimensional plane by connecting points of equal value with contour lines
レシピ
矩形等高線プロット
矩形等高線プロット
等間隔に配置された点を持つ矩形等高線プロットは、3D 点の 2D 配列から作成できます。
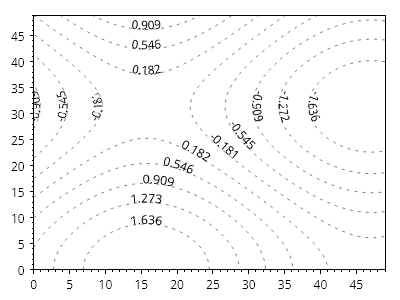
ScottPlot.Plot myPlot = new();

Coordinates3d[,] cs = new Coordinates3d[50, 50];
for (int y = 0; y < cs.GetLength(0); y++)
{
    for (int x = 0; x < cs.GetLength(1); x++)
    {
        double z = Math.Sin(x *.1) + Math.Cos(y* .1);
        cs[y, x] = new(x, y, z);
    }
}

var contour = myPlot.Add.ContourLines(cs);
contour.LineColor = Colors.Black.WithAlpha(.5);
contour.LinePattern = LinePattern.Dotted;

myPlot.Axes.TightMargins();
myPlot.HideGrid();

myPlot.SavePng("demo.png", 400, 300);
不規則な等高線プロット
不規則な等高線プロット
等高線プロットは、X/Y 平面上に任意に配置された 3D データポイントのコレクションから作成できます。
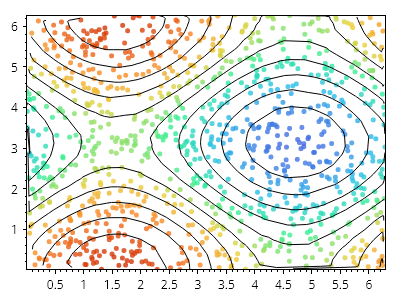
ScottPlot.Plot myPlot = new();

// 不規則な間隔の X/Y/Z データポイントを生成する
Coordinates3d[] cs = new Coordinates3d[1000];
for (int i = 0; i < cs.Length; i++)
{
    double x = Generate.RandomNumber(0, Math.PI *2);
    double y = Generate.RandomNumber(0, Math.PI* 2);
    double z = Math.Sin(x) + Math.Cos(y);
    cs[i] = new(x, y, z);
}

// 各データポイントにマーカーを配置する
double minZ = cs.Select(x => x.Z).Min();
double maxZ = cs.Select(x => x.Z).Max();
double spanZ = maxZ - minZ;
IColormap cmap = new ScottPlot.Colormaps.MellowRainbow();
for (int i = 0; i < cs.Length; i++)
{
    double fraction = (cs[i].Z - minZ) / (spanZ);
    var marker = myPlot.Add.Marker(cs[i].X, cs[i].Y);
    marker.Color = cmap.GetColor(fraction).WithAlpha(.8);
    marker.Size = 5;
}

// 等高線を表示する
var contour = myPlot.Add.ContourLines(cs);

// プロットのスタイルを設定する
myPlot.Axes.TightMargins();
myPlot.HideGrid();

myPlot.SavePng("demo.png", 400, 300);
ヒートマップ付き等高線
ヒートマップ付き等高線
等高線はヒートマップの上に配置できます。
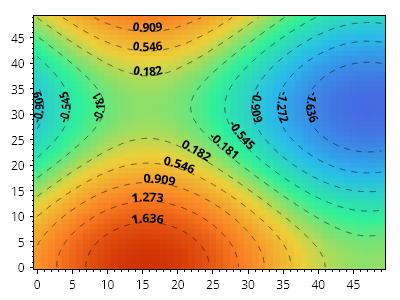
ScottPlot.Plot myPlot = new();

Coordinates3d[,] cs = new Coordinates3d[50, 50];
for (int y = 0; y < cs.GetLength(0); y++)
{
    for (int x = 0; x < cs.GetLength(1); x++)
    {
        double z = Math.Sin(x *.1) + Math.Cos(y* .1);
        cs[y, x] = new(x, y, z);
    }
}

var heatmap = myPlot.Add.Heatmap(cs);
heatmap.FlipVertically = true;
heatmap.Colormap = new ScottPlot.Colormaps.MellowRainbow();

var contour = myPlot.Add.ContourLines(cs);
contour.LabelStyle.Bold = true;
contour.LinePattern = LinePattern.DenselyDashed;
contour.LineColor = Colors.Black.WithAlpha(.5);

myPlot.Axes.TightMargins();
myPlot.HideGrid();

myPlot.SavePng("demo.png", 400, 300);
カラーマップ付き等高線
カラーマップ付き等高線
カラーマップが提供されている場合、各線はその値に応じてカラーマップで色付けされます。
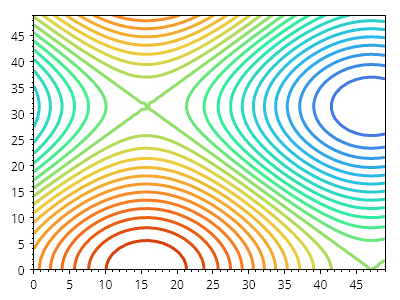
ScottPlot.Plot myPlot = new();

Coordinates3d[,] cs = new Coordinates3d[50, 50];
for (int y = 0; y < cs.GetLength(0); y++)
{
    for (int x = 0; x < cs.GetLength(1); x++)
    {
        double z = Math.Sin(x *.1) + Math.Cos(y* .1);
        cs[y, x] = new(x, y, z);
    }
}

var cl = myPlot.Add.ContourLines(cs, count: 25);
cl.Colormap = new ScottPlot.Colormaps.MellowRainbow();
cl.LineWidth = 3;
cl.LabelStyle.IsVisible = false;

myPlot.Axes.TightMargins();
myPlot.HideGrid();

myPlot.SavePng("demo.png", 400, 300);
Coxcomb プロット
A Coxcomb chart is a pie graph where the angle of slices is constant but the radii are not.
レシピ
Coxcomb プロットのクイックスタート
Coxcomb プロットのクイックスタート
Coxcomb チャートは、スライスの角度は一定だが半径は一定ではない円グラフです。
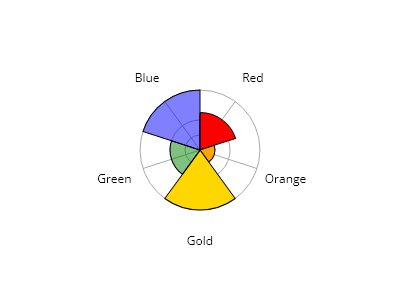
ScottPlot.Plot myPlot = new();

List<PieSlice> slices = new()
{
    new() { Value = 5, Label = "赤", FillColor = Colors.Red },
    new() { Value = 2, Label = "オレンジ", FillColor = Colors.Orange },
    new() { Value = 8, Label = "金", FillColor = Colors.Gold },
    new() { Value = 4, Label = "緑", FillColor = Colors.Green.WithOpacity(0.5) },
    new() { Value = 8, Label = "青",  FillColor = Colors.Blue.WithOpacity(0.5) },
};

var cox = myPlot.Add.Coxcomb(slices);
cox.SliceLabelDistance = 1.5;

myPlot.Axes.Frameless();
myPlot.ShowLegend();
myPlot.HideGrid();

myPlot.SavePng("demo.png", 400, 300);
Crosshair
A Crosshair combines a horizontal axis line and vertical axis line to mark a location in coordinate space.
レシピ
Crosshair クイックスタート
Crosshair クイックスタート
Crosshair は、水平軸線と垂直軸線を組み合わせて、座標空間内の位置を示します。
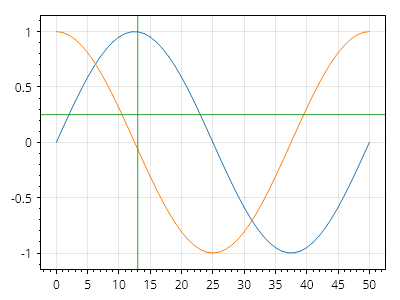
ScottPlot.Plot myPlot = new();

myPlot.Add.Signal(Generate.Sin());
myPlot.Add.Signal(Generate.Cos());

myPlot.Add.Crosshair(13, .25);

myPlot.SavePng("demo.png", 400, 300);
十字線のカスタマイズ
十字線のカスタマイズ
十字線は広範囲にカスタマイズできます。
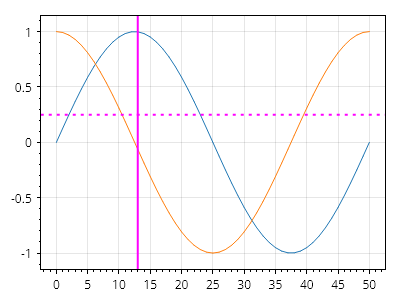
ScottPlot.Plot myPlot = new();

myPlot.Add.Signal(Generate.Sin());
myPlot.Add.Signal(Generate.Cos());

var cross = myPlot.Add.Crosshair(13, .25);

// プロパティは両方の線のスタイルを設定します
cross.LineWidth = 2;
cross.LineColor = Colors.Magenta;

// 各線のスタイルには個別にアクセスすることもできます
cross.HorizontalLine.LinePattern = LinePattern.Dotted;

myPlot.SavePng("demo.png", 400, 300);
楕円
Ellipses are curves with a defined center and distinct X and Y radii. A circle is an ellipse with an X radius equal to its Y radius.
レシピ
楕円のクイックスタート
楕円のクイックスタート
楕円をプロットに追加できます
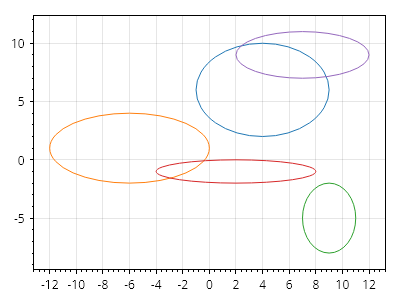
ScottPlot.Plot myPlot = new();

Random rand = new(0);
for (int i = 0; i < 5; i++)
{
    myPlot.Add.Ellipse(
        xCenter: rand.Next(-10, 10),
        yCenter: rand.Next(-10, 10),
        radiusX: rand.Next(1, 7),
        radiusY: rand.Next(1, 7));
}

myPlot.SavePng("demo.png", 400, 300);
円のクイックスタート
円のクイックスタート
円をプロットに追加できます。円は、X 半径と Y 半径が同じ楕円です。プロットが正方形の座標系でない限り、円は楕円として表示されることに注意してください。
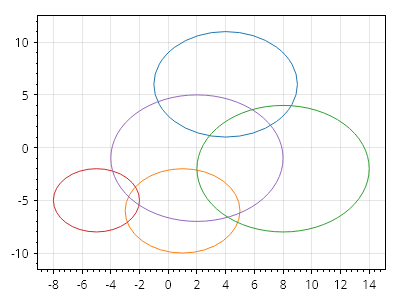
ScottPlot.Plot myPlot = new();

Random rand = new(0);
for (int i = 0; i < 5; i++)
{
    myPlot.Add.Circle(
        xCenter: rand.Next(-10, 10),
        yCenter: rand.Next(-10, 10),
        radius: rand.Next(1, 7));
}

myPlot.SavePng("demo.png", 400, 300);
スケールをロックした円
スケールをロックした円
円が常に円形に表示されるようにするには、座標系で常に正方形のピクセルを表示するよう強制する必要があります。これは、軸スケールのロックを有効にすることで実現できます。
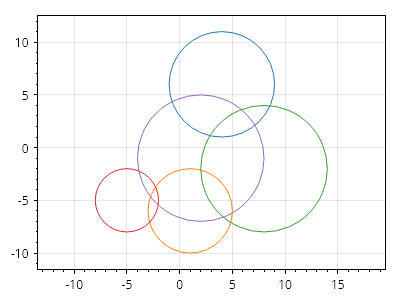
ScottPlot.Plot myPlot = new();

Random rand = new(0);
for (int i = 0; i < 5; i++)
{
    myPlot.Add.Circle(
        xCenter: rand.Next(-10, 10),
        yCenter: rand.Next(-10, 10),
        radius: rand.Next(1, 7));
}

// ピクセルのスケール比を 1:1 に強制する
myPlot.Axes.SquareUnits();

myPlot.SavePng("demo.png", 400, 300);
楕円のスタイル設定
楕円のスタイル設定
楕円のスタイルは幅広くカスタマイズできます
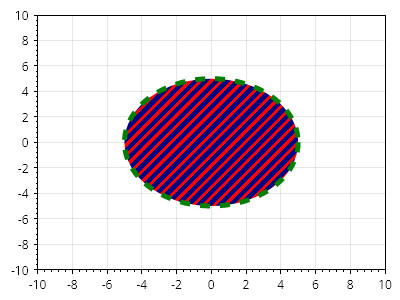
ScottPlot.Plot myPlot = new();

var circle = myPlot.Add.Circle(center: Coordinates.Origin, radius: 5);
circle.LineStyle.Width = 5;
circle.LineStyle.Pattern = LinePattern.Dashed;
circle.LineStyle.Color = Colors.Green;
circle.FillStyle.Color = Colors.Navy;
circle.FillStyle.HatchColor = Colors.Red;
circle.FillStyle.Hatch = new ScottPlot.Hatches.Striped();

myPlot.Axes.SetLimits(-10, 10, -10, 10);

myPlot.SavePng("demo.png", 400, 300);
楕円の回転
楕円の回転
楕円は回転させることもできます
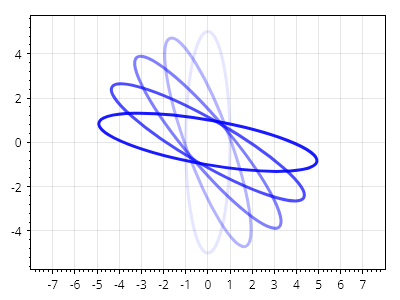
ScottPlot.Plot myPlot = new();

Coordinates center = new(0, 0);
double radiusX = 1;
double radiusY = 5;

for (int i = 0; i < 5; i++)
{
    Angle angle = Angle.FromDegrees(i *20);
    var el = myPlot.Add.Ellipse(center, radiusX, radiusY, angle);
    el.LineWidth = 3;
    el.LineColor = Colors.Blue.WithAlpha(0.1 + 0.2* i);
}

// ピクセルが 1:1 のスケール比になるように強制する
ScottPlot.AxisRules.SquareZoomOut rule = new(myPlot.Axes.Bottom, myPlot.Axes.Left);
myPlot.Axes.Rules.Add(rule);

myPlot.SavePng("demo.png", 400, 300);
誤差バー
Error Bars communicate the range of possible values for a measurement
レシピ
エラーバーのクイックスタート
エラーバーのクイックスタート
エラーバーは散布図と相性が良好です。
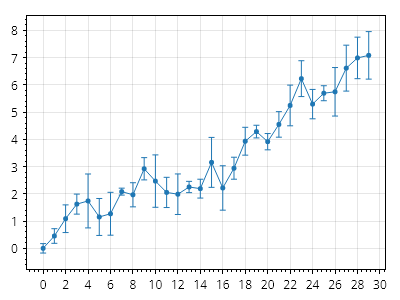
ScottPlot.Plot myPlot = new();

int points = 30;

double[] xs = Generate.Consecutive(points);
double[] ys = Generate.RandomWalk(points);
double[] err = Generate.RandomSample(points, 0.1, 1);

var scatter = myPlot.Add.Scatter(xs, ys);
var errorbars = myPlot.Add.ErrorBar(xs, ys, err);
errorbars.Color = scatter.Color;

myPlot.SavePng("demo.png", 400, 300);
ErrorBar 値
ErrorBar 値
エラーサイズはすべての次元に対して設定できます。
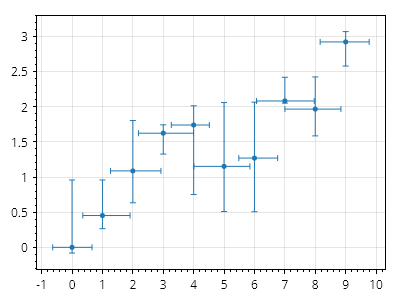
ScottPlot.Plot myPlot = new();

int points = 10;

double[] xs = Generate.Consecutive(points);
double[] ys = Generate.RandomWalk(points);
var scatter = myPlot.Add.Scatter(xs, ys);
scatter.LineStyle.Width = 0;

ScottPlot.Plottables.ErrorBar eb = new(
    xs: xs,
    ys: ys,
    xErrorsNegative: Generate.RandomSample(points, .5),
    xErrorsPositive: Generate.RandomSample(points, .5),
    yErrorsNegative: Generate.RandomSample(points),
    yErrorsPositive: Generate.RandomSample(points));

eb.Color = scatter.Color;

myPlot.Add.Plottable(eb);

myPlot.SavePng("demo.png", 400, 300);
FillY プロット
FillY plots display the vertical range between two Y values at defined X positions
レシピ
配列データからの FillY
配列データからの FillY
FillY プロットは、X、Y1、Y2 配列から作成できます。
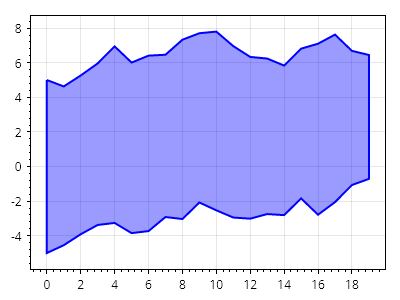
ScottPlot.Plot myPlot = new();

RandomDataGenerator dataGen = new(0);

int count = 20;
double[] xs = Generate.Consecutive(count);
double[] ys1 = dataGen.RandomWalk(count, offset: -5);
double[] ys2 = dataGen.RandomWalk(count, offset: 5);

var fill = myPlot.Add.FillY(xs, ys1, ys2);
fill.FillColor = Colors.Blue.WithAlpha(100);
fill.LineColor = Colors.Blue;
fill.MarkerColor = Colors.Blue;
fill.LineWidth = 2;

myPlot.SavePng("demo.png", 400, 300);
散布図からの FillY
散布図からの FillY
FillY プロットは、同じ X 値を共有する 2 つの散布図から作成できます。
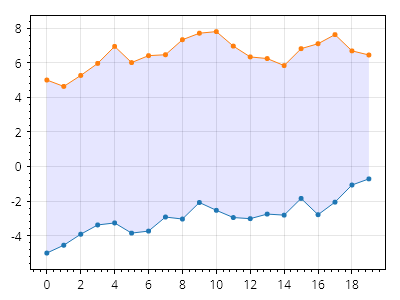
ScottPlot.Plot myPlot = new();

RandomDataGenerator dataGen = new(0);

int count = 20;
double[] xs = Generate.Consecutive(count);
double[] ys1 = dataGen.RandomWalk(count, offset: -5);
double[] ys2 = dataGen.RandomWalk(count, offset: 5);

var scatter1 = myPlot.Add.Scatter(xs, ys1);
var scatter2 = myPlot.Add.Scatter(xs, ys2);

var fill = myPlot.Add.FillY(scatter1, scatter2);
fill.FillColor = Colors.Blue.WithAlpha(.1);
fill.LineWidth = 0;

// 塗りつぶしを散布図の背後に移動する
myPlot.MoveToBack(fill);

myPlot.SavePng("demo.png", 400, 300);
カスタム型での FillY
カスタム型での FillY
変換関数を指定すれば、任意の型のデータから FillY プロットを作成できます。
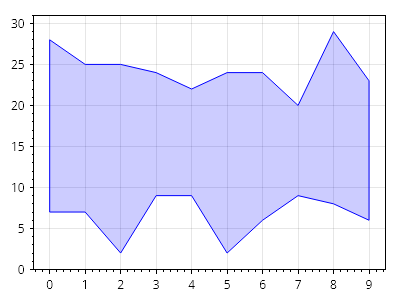
ScottPlot.Plot myPlot = new();

// 非標準のデータ型でソースデータを作成する
List<(int, int, int)> data = new();
Random rand = new(0);
for (int i = 0; i < 10; i++)
{
    int x = i;
    int y1 = rand.Next(0, 10);
    int y2 = rand.Next(20, 30);
    data.Add((x, y1, y2));
}

// ソースデータ型用のカスタムコンバーターを作成する
static (double, double, double) MyConverter((int, int, int) s) => (s.Item1, s.Item2, s.Item3);

// カスタムコンバーターを使用してソースデータから塗りつぶしプロットを作成する
var fill = myPlot.Add.FillY(data, MyConverter);
fill.FillColor = Colors.Blue.WithAlpha(.2);
fill.LineColor = Colors.Blue;

myPlot.SavePng("demo.png", 400, 300);
FillY プロットのスタイリング
FillY プロットのスタイリング
FillY プロットは、public プロパティを使用してカスタマイズできます。
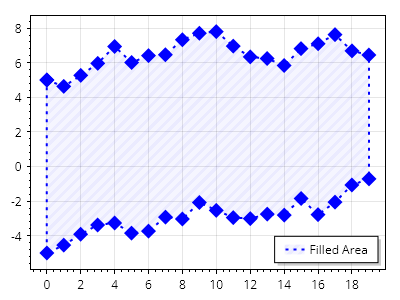
ScottPlot.Plot myPlot = new();

int count = 20;
double[] xs = Generate.Consecutive(count);
double[] ys1 = Generate.RandomWalk(count, offset: -5);
double[] ys2 = Generate.RandomWalk(count, offset: 5);

var fill = myPlot.Add.FillY(xs, ys1, ys2);
fill.MarkerShape = MarkerShape.FilledDiamond;
fill.MarkerSize = 15;
fill.MarkerColor = Colors.Blue;
fill.LineColor = Colors.Blue;
fill.LinePattern = LinePattern.Dotted;
fill.LineWidth = 2;
fill.FillColor = Colors.Blue.WithAlpha(.2);
fill.FillHatch = new ScottPlot.Hatches.Striped(ScottPlot.Hatches.StripeDirection.DiagonalUp);
fill.FillHatchColor = Colors.Blue.WithAlpha(.4);
fill.LegendText = "塗りつぶし領域";

myPlot.ShowLegend();

myPlot.SavePng("demo.png", 400, 300);
塗りつぶしエラー
塗りつぶしエラー
エラー範囲を網掛けした折れ線プロットは、ScatterLine の下に FillY を重ねることで実現できます。
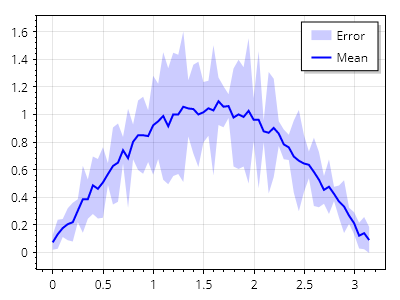
ScottPlot.Plot myPlot = new();

// サンプルの Y 値を作成する
double[] xs = Generate.Range(0, Math.PI, 0.05);
double[] ys = xs.Select(x => Math.Sin(x) + Generate.RandomNumber(0.1)).ToArray();

// サンプルのエラーデータを作成する
double[] yErr = ys.Select(x => x * Generate.RandomNumber(0.5) + 0.05).ToArray();

// Y ± エラーを計算する
double[] yErrNeg = Enumerable.Range(0, ys.Length).Select(x => ys[x] - yErr[x]).ToArray();
double[] yErrPos = Enumerable.Range(0, ys.Length).Select(x => ys[x] + yErr[x]).ToArray();

// エラー範囲の間に網掛け領域を追加する
var errFill = myPlot.Add.FillY(xs, yErrNeg, yErrPos);
errFill.LineWidth = 0;
errFill.FillColor = Colors.Blue.WithAlpha(0.2);
errFill.LegendText = "エラー";

// Y 値を折れ線プロットとして追加する
var meanLine = myPlot.Add.ScatterLine(xs, ys);
meanLine.LineColor = Colors.Blue;
meanLine.LineWidth = 2;
meanLine.LegendText = "平均";

// 凡例の位置を設定する
myPlot.Legend.Alignment = Alignment.UpperRight;

myPlot.SavePng("demo.png", 400, 300);
金融プロット
Finance plots display price data binned into time ranges
レシピ
- ローソク足チャート
- OHLCチャート
- カスタム時間ビンを使用した金融チャート
- 右側に価格
- 単純移動平均
- ボリンジャーバンド
- ギャップのないローソク足チャート
- ギャップのないOHLCチャート
- 株式シンボルの背景
- 株式シンボルの複数行表示
- 財務チャートのダークモード
- 金融 DateTime 軸
ローソク足チャート
ローソク足チャート
ローソク足チャートは、シンボルを使用して価格データを表示します。長方形は始値と終値を示し、中央の線は指定された期間における最低価格と最高価格を示します。色は、始値から終値までの間に価格が上昇したか下落したかを示します。
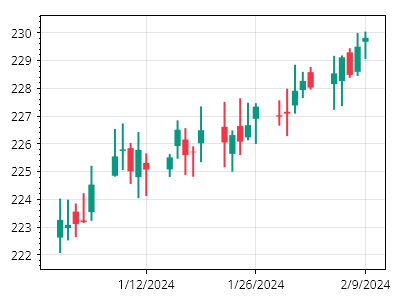
ScottPlot.Plot myPlot = new();

var prices = Generate.RandomOHLCs(30);
myPlot.Add.Candlestick(prices);
myPlot.Axes.DateTimeTicksBottom();

myPlot.SavePng("demo.png", 400, 300);
OHLCチャート
OHLCチャート
OHLCチャートは、特定の時間範囲における価格データ(始値、高値、安値、終値)を記号で表示します。
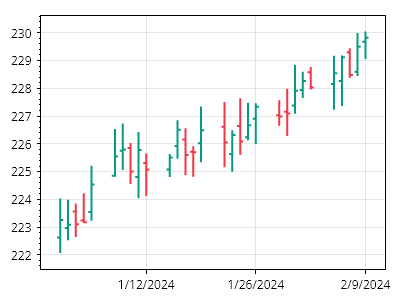
ScottPlot.Plot myPlot = new();

var prices = Generate.RandomOHLCs(30);
myPlot.Add.OHLC(prices);
myPlot.Axes.DateTimeTicksBottom();

myPlot.SavePng("demo.png", 400, 300);
カスタム時間ビンを使用した金融チャート
カスタム時間ビンを使用した金融チャート
金融チャートでは、任意の時間スケールで価格範囲情報を表示できます。
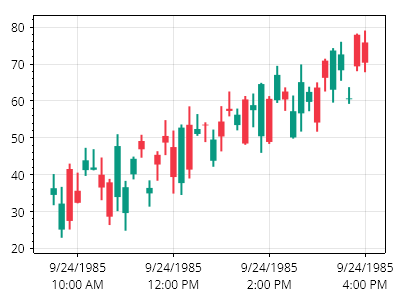
ScottPlot.Plot myPlot = new();

DateTime timeOpen = new(1985, 09, 24, 9, 30, 0); // 午前9:30
DateTime timeClose = new(1985, 09, 24, 16, 0, 0); // 午後4:00
TimeSpan timeSpan = TimeSpan.FromMinutes(10); // 10分間のビン

List<OHLC> prices = new();
for (DateTime dt = timeOpen; dt <= timeClose; dt += timeSpan)
{
    double open = Generate.RandomNumber(20, 40) + prices.Count;
    double close = Generate.RandomNumber(20, 40) + prices.Count;
    double high = Math.Max(open, close) + Generate.RandomNumber(5);
    double low = Math.Min(open, close) - Generate.RandomNumber(5);
    prices.Add(new OHLC(open, high, low, close, dt, timeSpan));
}

myPlot.Add.Candlestick(prices);
myPlot.Axes.DateTimeTicksBottom();

myPlot.SavePng("demo.png", 400, 300);
右側に価格
右側に価格
右軸に価格情報を表示するファイナンスチャートを作成できます。
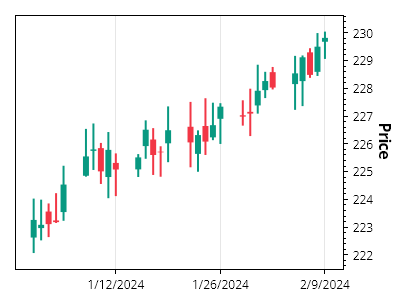
ScottPlot.Plot myPlot = new();

// ローソク足をプロットに追加する
var prices = Generate.RandomOHLCs(30);
var candles = myPlot.Add.Candlestick(prices);

// プロットの右軸を使用するようにローソク足を設定する
candles.Axes.YAxis = myPlot.Axes.Right;
candles.Axes.YAxis.Label.Text = "価格";

// 日付を表示するように下軸をスタイル設定する
myPlot.Axes.DateTimeTicksBottom();

myPlot.SavePng("demo.png", 400, 300);
単純移動平均
単純移動平均
単純移動平均(SMA)曲線を作成し、それを金融データの横に表示するためのツールがあります。
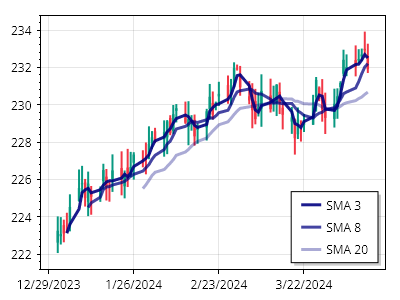
ScottPlot.Plot myPlot = new();

// 時系列の価格データを生成してプロットする
var prices = Generate.RandomOHLCs(75);
myPlot.Add.Candlestick(prices);
myPlot.Axes.DateTimeTicksBottom();

// SMAを計算し、散布図として表示する
int[] windowSizes = { 3, 8, 20 };
foreach (int windowSize in windowSizes)
{
    ScottPlot.Finance.SimpleMovingAverage sma = new(prices, windowSize);
    var sp = myPlot.Add.Scatter(sma.Dates, sma.Means);
    sp.LegendText = $"SMA {windowSize}";
    sp.MarkerSize = 0;
    sp.LineWidth = 3;
    sp.Color = Colors.Navy.WithAlpha(1 - windowSize / 30.0);
}

myPlot.ShowLegend();

myPlot.SavePng("demo.png", 400, 300);
ボリンジャーバンド
ボリンジャーバンド
時系列の金融データに対して、重み付き移動平均と分散を表示するボリンジャーバンドを作成するためのツールがあります。
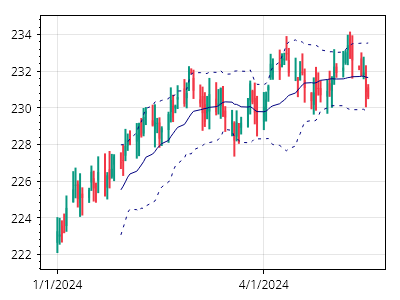
ScottPlot.Plot myPlot = new();

// 時系列の価格データを生成してプロットする
var prices = Generate.RandomOHLCs(100);
myPlot.Add.Candlestick(prices);
myPlot.Axes.DateTimeTicksBottom();

// ボリンジャーバンドを計算する
ScottPlot.Finance.BollingerBands bb = new(prices, 20);

// 中央線(平均)を実線として表示する
var sp1 = myPlot.Add.Scatter(bb.Dates, bb.Means);
sp1.MarkerSize = 0;
sp1.Color = Colors.Navy;

// 上側のバンド(正の分散)を破線として表示する
var sp2 = myPlot.Add.Scatter(bb.Dates, bb.UpperValues);
sp2.MarkerSize = 0;
sp2.Color = Colors.Navy;
sp2.LinePattern = LinePattern.Dotted;

// 下側のバンド(正の分散)を破線として表示する
var sp3 = myPlot.Add.Scatter(bb.Dates, bb.LowerValues);
sp3.MarkerSize = 0;
sp3.Color = Colors.Navy;
sp3.LinePattern = LinePattern.Dotted;

myPlot.SavePng("demo.png", 400, 300);
ギャップのないローソク足チャート
ギャップのないローソク足チャート
OHLC オブジェクトに格納された DateTime を使用してローソク足の水平位置を決定すると、週末や祝日などデータのない期間がプロット上にギャップとして表示されます。シーケンシャルモードを有効にすると、プロットは OHLC の DateTime を無視し、0 から始まる整数位置にローソク足を表示します。必要に応じて、ユーザーは目盛りジェネレーターをカスタマイズして、水平軸に数値ではなく日付を表示できます。
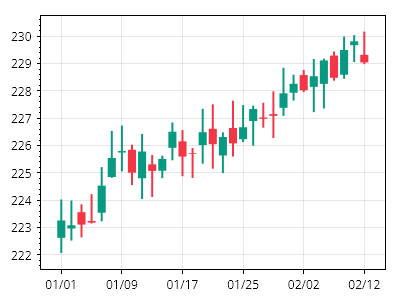
ScottPlot.Plot myPlot = new();

// ローソク足プロットを作成する
var prices = Generate.RandomOHLCs(31);
var candlePlot = myPlot.Add.Candlestick(prices);

// ローソク足を X = 0, 1, 2, ... に配置するためにシーケンシャルモードを有効にする
candlePlot.Sequential = true;

// 目盛りを表示するローソク足をいくつか決定する
int tickCount = 5;
int tickDelta = prices.Count / tickCount;
DateTime[] tickDates = prices
    .Where((x, i) => i % tickDelta == 0)
    .Select(x => x.DateTime)
    .ToArray();

// デフォルトでは、水平目盛りラベルは数値(1, 2, 3...)になります
// 手動の目盛りジェネレーターを使用して、水平軸に日付を表示できます
double[] tickPositions = Generate.Consecutive(tickDates.Length, tickDelta);
string[] tickLabels = tickDates.Select(x => x.ToString("MM/dd")).ToArray();
ScottPlot.TickGenerators.NumericManual tickGen = new(tickPositions, tickLabels);
myPlot.Axes.Bottom.TickGenerator = tickGen;

myPlot.SavePng("demo.png", 400, 300);
ギャップのないOHLCチャート
ギャップのないOHLCチャート
OHLCオブジェクトに格納されたDateTimeを水平位置の決定に使用すると、週末や祝日などデータのない期間がプロット内のギャップとして表示されます。シーケンシャルモードを有効にすると、プロットはOHLCのDateTimeを無視し、0から始まる整数位置にOHLCを配置します。必要に応じて、ユーザーは目盛りジェネレーターをカスタマイズして、水平軸に数値の代わりに日付を表示できます。
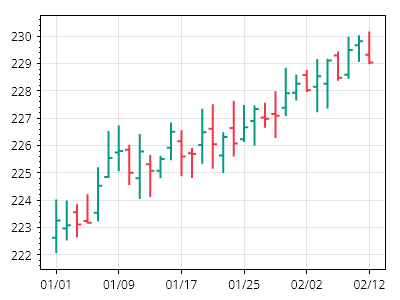
ScottPlot.Plot myPlot = new();

// OHLCプロットを作成する
var prices = Generate.RandomOHLCs(31);
var ohlcPlot = myPlot.Add.OHLC(prices);

// OHLCをX = 0, 1, 2, ...に配置するためにシーケンシャルモードを有効にする
ohlcPlot.Sequential = true;

// 目盛りを表示するいくつかのOHLCを決定する
int tickCount = 5;
int tickDelta = prices.Count / tickCount;
DateTime[] tickDates = prices
    .Where((x, i) => i % tickDelta == 0)
    .Select(x => x.DateTime)
    .ToArray();

// デフォルトでは、水平目盛りラベルは数値(1, 2, 3...)になります
// 手動の目盛りジェネレーターを使用して、水平軸に日付を表示できます
double[] tickPositions = Generate.Consecutive(tickDates.Length, tickDelta);
string[] tickLabels = tickDates.Select(x => x.ToString("MM/dd")).ToArray();
ScottPlot.TickGenerators.NumericManual tickGen = new(tickPositions, tickLabels);
myPlot.Axes.Bottom.TickGenerator = tickGen;

myPlot.SavePng("demo.png", 400, 300);
株式シンボルの背景
株式シンボルの背景
背景テキスト機能を使用すると、株式シンボル情報をプロットの下に表示できます。
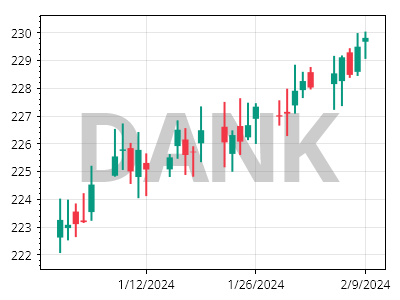
ScottPlot.Plot myPlot = new();

myPlot.Add.Candlestick(Generate.RandomOHLCs(30));
myPlot.Axes.DateTimeTicksBottom();

var line1 = myPlot.Add.BackgroundText("DANK");
line1.LabelFontColor = Colors.Gray.WithAlpha(.4);
line1.LabelFontSize = 96;
line1.LabelBold = true;

myPlot.SavePng("demo.png", 400, 300);
株式シンボルの複数行表示
株式シンボルの複数行表示
複数行の背景テキスト機能を使用して、プロットの下に株式シンボル情報を表示できます。
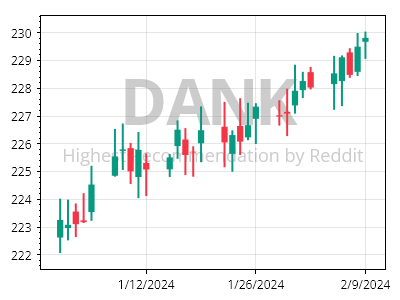
ScottPlot.Plot myPlot = new();

myPlot.Add.Candlestick(Generate.RandomOHLCs(30));
myPlot.Axes.DateTimeTicksBottom();

(var line1, var line2) = myPlot.Add.BackgroundText("DANK", "Highest Recommendation by Reddit");

line1.LabelFontColor = Colors.Gray.WithAlpha(.4);
line1.LabelFontSize = 64;
line1.LabelBold = true;

line2.LabelFontColor = Colors.Gray.WithAlpha(.4);
line2.LabelFontSize = 18;
line2.LabelBold = false;

myPlot.SavePng("demo.png", 400, 300);
財務チャートのダークモード
財務チャートのダークモード
ローソク足と図の色オプションをカスタマイズすることで、ダークモードの財務プロットを実現できます。
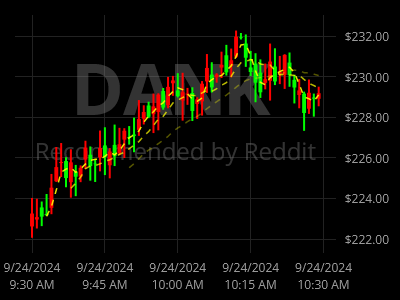
ScottPlot.Plot myPlot = new();

// サンプルの財務データを追加する
OHLC[] prices = Generate.Financial.OHLCsByMinute(60);
var candlePlot = myPlot.Add.Candlestick(prices);
candlePlot.Axes.YAxis = myPlot.Axes.Right;

// 下部に DateTime 目盛りを設定する
myPlot.Axes.DateTimeTicksBottom();

// 右側に通貨の目盛り書式を使用する
myPlot.Axes.Right.TickGenerator = new ScottPlot.TickGenerators.NumericAutomatic()
{
    LabelFormatter = (double value) => value.ToString("C")
};

// ローソク足のスタイルをカスタマイズする
candlePlot.RisingColor = ScottPlot.Color.FromHtml("#FF0000");
candlePlot.FallingColor = ScottPlot.Color.FromHtml("#00FF00");

// SMA インジケーターを追加する
int[] windowSizes = { 3, 8, 20 };
foreach (int windowSize in windowSizes)
{
    ScottPlot.Finance.SimpleMovingAverage sma = new(prices, windowSize);
    var sp = myPlot.Add.Scatter(sma.Dates, sma.Means);
    sp.Axes.YAxis = myPlot.Axes.Right;
    sp.MarkerSize = 0;
    sp.LineWidth = 1.5f;
    sp.LinePattern = LinePattern.DenselyDashed;
    sp.Color = Colors.Yellow.WithAlpha(1 - windowSize / 30.0);
}

// 銘柄情報を追加し、プロットの背面へ移動する
(var line1, var line2) = myPlot.Add.BackgroundText("DANK", "Reddit による推奨");

line1.LabelFontColor = Colors.Gray.WithAlpha(.4);
line1.LabelFontSize = 72;
line1.LabelBold = true;
line1.Axes.YAxis = myPlot.Axes.Right;

line2.LabelFontColor = Colors.Gray.WithAlpha(.4);
line2.LabelFontSize = 24;
line2.LabelBold = false;
line2.Axes.YAxis = myPlot.Axes.Right;

// その他のプロットコンポーネントの色をカスタマイズする
myPlot.FigureBackground.Color = Colors.Black;
myPlot.DataBackground.Color = Colors.Black;
myPlot.Axes.Color(ScottPlot.Color.FromHtml("#999999"));
myPlot.Axes.Right.MajorTickStyle.Color = Colors.Transparent;
myPlot.Axes.Right.MinorTickStyle.Color = Colors.Transparent;
myPlot.Axes.Bottom.MajorTickStyle.Color = Colors.Transparent;
myPlot.Axes.FrameWidth(0);
myPlot.Grid.MajorLineColor = ScottPlot.Color.FromHtml("#222222");
myPlot.Grid.YAxis = myPlot.Axes.Right;

myPlot.SavePng("demo.png", 400, 300);
金融 DateTime 軸
金融 DateTime 軸
金融チャート用に特別な軸システムが作成されています。標準の DateTime 軸は水平スケールが線形に配置された時刻であると仮定するのに対し、金融 DateTime システムでは日付をスキップできます。これは、時間外取引や非取引日など、日付範囲がスキップされる金融チャートに最適です。
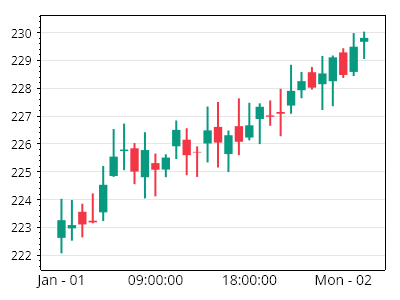
ScottPlot.Plot myPlot = new();

// 日付と価格範囲のコレクションを使用してサンプルデータを生成する
DateTime[] dates = Generate.ConsecutiveHours(100);
List<OHLC> candles = Generate.RandomOHLCs(30);
var candlestickPlot = myPlot.Add.Candlestick(candles);

// ローソク足が 1 単位間隔(0、1、2 など)で配置されるようにシーケンシャルモードを有効にする
candlestickPlot.Sequential = true;

// デフォルトの目盛りジェネレーター(およびグリッド)を無効にし、新しいもののためのスペースを確保する
myPlot.Axes.Bottom.TickGenerator = new ScottPlot.TickGenerators.EmptyTickGenerator();
myPlot.Axes.Bottom.MinimumSize = 30;

// 金融 DateTime 目盛りジェネレーターを追加する
ScottPlot.Plottables.FinancialTimeAxis financeAxis = new(dates);
myPlot.Add.Plottable(financeAxis);

myPlot.SavePng("demo.png", 400, 300);
Function
Function plots are a type of line plot where Y positions are defined by a function that depends on X rather than a collection of discrete data points.
レシピ
関数クイックスタート
関数クイックスタート
数式から関数プロットを作成します。
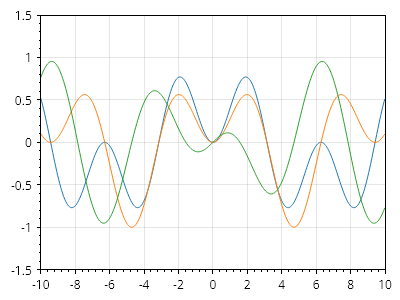
ScottPlot.Plot myPlot = new();

// 関数は、入力と出力を持つデリゲートとして定義されます
static double func1(double x) => (Math.Sin(x) *Math.Sin(x / 2));
static double func2(double x) => (Math.Sin(x)* Math.Sin(x / 3));
static double func3(double x) => (Math.Cos(x) * Math.Sin(x / 5));

// 関数をプロットに追加します
myPlot.Add.Function(func1);
myPlot.Add.Function(func2);
myPlot.Add.Function(func3);

// 関数には離散データ点がないため、軸の範囲を手動で設定します
myPlot.Axes.SetLimits(-10, 10, -1.5, 1.5);

myPlot.SavePng("demo.png", 400, 300);
関数の X 範囲制限
関数の X 範囲制限
関数は X 値の範囲に制限できます。
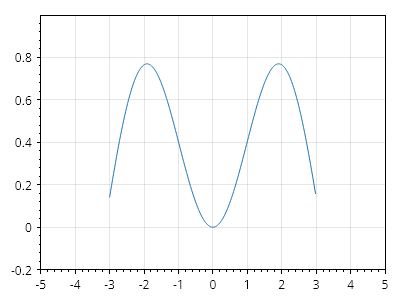
ScottPlot.Plot myPlot = new();

static double func1(double x) => (Math.Sin(x) * Math.Sin(x / 2));

var f = myPlot.Add.Function(func1);
f.MinX = -3;
f.MaxX = 3;

myPlot.Axes.SetLimits(-5, 5, -.2, 1.0);

myPlot.SavePng("demo.png", 400, 300);
動的に生成される関数
動的に生成される関数
関数を静的メソッドとして表現できない場合(たとえば、カスタムパラメーターが必要な関数)、Func<double, double> 型の変数として表現し、それに応じてプロットできます。
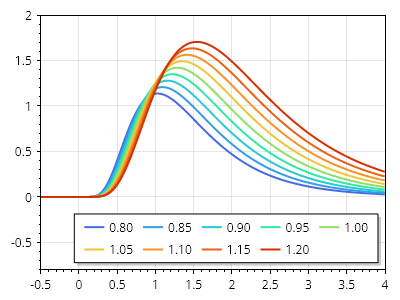
ScottPlot.Plot myPlot = new();

static double LogNormalDist(double x, double a, double b)
{
    double expNum = Math.Log(x / a);
    double exp = Math.Exp(-(expNum *expNum) / (2* b *b));
    double y = Math.Sqrt(2* Math.PI) *b* x * exp;
    return double.IsNaN(y) ? 0 : y;
}

double[] testValues = Generate.Range(0.8, 1.2, 0.05);
Color[] colors = new ScottPlot.Colormaps.MellowRainbow().GetColors(testValues.Length);
for (int i = 0; i < testValues.Length; i++)
{
    double testValue = testValues[i];
    var myFunc = new Func<double, double>((x) => LogNormalDist(x, testValue, 0.5));
    var funcPlot = myPlot.Add.Function(myFunc);
    funcPlot.LegendText = $"{testValue:0.00}";
    funcPlot.LineWidth = 2;
    funcPlot.LineColor = colors[i];
}

myPlot.ShowLegend();
myPlot.Legend.Orientation = Orientation.Horizontal;

myPlot.Axes.SetLimitsX(-0.5, 4);
myPlot.Axes.SetLimitsY(-0.8, 2);

myPlot.SavePng("demo.png", 400, 300);
ヒートマップ
Heatmaps display values from 2D data as an image with cells of different intensities
レシピ
- ヒートマップのクイックスタート
- 反転ヒートマップ
- カスタムカラーマップを使用したヒートマップ
- 透明なカラーマップを使用したヒートマップ
- 複数のカラーバー
- カラーバーのタイトル
- カラーバーの目盛りフォーマッター
- 反転ヒートマップ
- 滑らかなヒートマップ
- 透明なセル
- グローバル透明度
- アルファマップ
- フレームレスヒートマップ
- HeatmapCellAlignment
- ヒートマップのセルサイズ
- ヒートマップの矩形
- 手動カラーレンジ付きヒートマップ
- ヒートマップのセルラベル
- DateTime 軸を使用したヒートマップ
ヒートマップのクイックスタート
ヒートマップのクイックスタート
ヒートマップは2D配列から作成できます
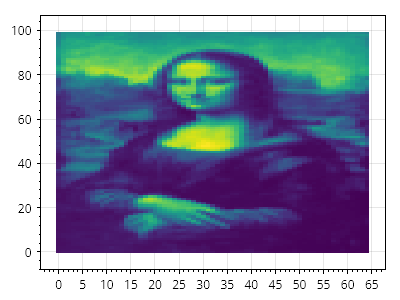
ScottPlot.Plot myPlot = new();

double[,] data = SampleData.MonaLisa();
myPlot.Add.Heatmap(data);

myPlot.SavePng("demo.png", 400, 300);
反転ヒートマップ
反転ヒートマップ
ヒートマップは、カラーマップ内の色の順序を逆にすることで反転できます
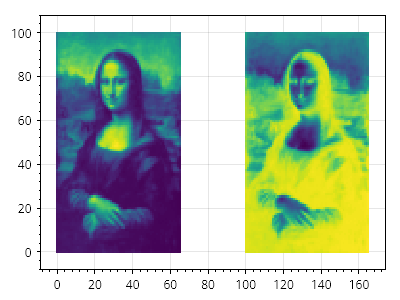
ScottPlot.Plot myPlot = new();

double[,] data = SampleData.MonaLisa();

var hm1 = myPlot.Add.Heatmap(data);
hm1.Colormap = new ScottPlot.Colormaps.Viridis();
hm1.Position = new(0, 65, 0, 100);

var hm2 = myPlot.Add.Heatmap(data);
hm2.Colormap = new ScottPlot.Colormaps.Viridis().Reversed();
hm2.Position = new(100, 165, 0, 100);

myPlot.SavePng("demo.png", 400, 300);
カスタムカラーマップを使用したヒートマップ
カスタムカラーマップを使用したヒートマップ
ヒートマップのカラーマップは、セルの値からセルの色へ変換するために使用されるロジックであり、ユーザーが設定できます。ScottPlot には多くの一般的なカラーマップが用意されていますが、ユーザーは IColormap を実装して独自のカラーマップを適用できます。どの色がどの値に対応するかを示すために、カラーバーを追加できます。
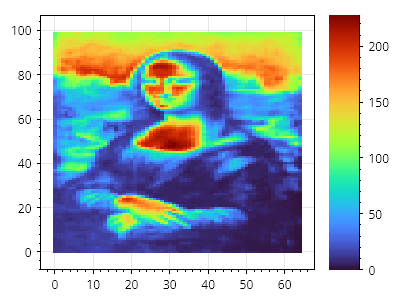
ScottPlot.Plot myPlot = new();

double[,] data = SampleData.MonaLisa();

var hm1 = myPlot.Add.Heatmap(data);
hm1.Colormap = new ScottPlot.Colormaps.Turbo();

myPlot.Add.ColorBar(hm1);

myPlot.SavePng("demo.png", 400, 300);
透明なカラーマップを使用したヒートマップ
透明なカラーマップを使用したヒートマップ
カスタムカラーマップには透明度を含めることができます。
![]()
ScottPlot.Plot myPlot = new();

double[,] data = SampleData.MonaLisa();
var hm1 = myPlot.Add.Heatmap(data);

Color[] colors = [Colors.Navy, Colors.Transparent, Colors.Orange];
hm1.Colormap = new ScottPlot.Colormaps.CustomInterpolated(colors);

myPlot.Add.ColorBar(hm1);

myPlot.SavePng("demo.png", 400, 300);
複数のカラーバー
複数のカラーバー
複数のカラーバーをプロットに追加できます。
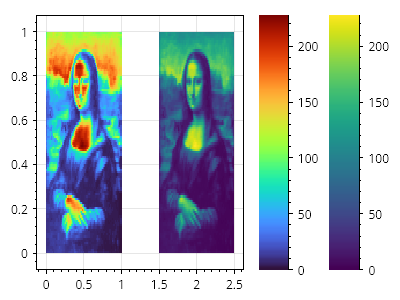
ScottPlot.Plot myPlot = new();

double[,] data = SampleData.MonaLisa();

var hm1 = myPlot.Add.Heatmap(data);
hm1.Rectangle = new(0, 1, 0, 1);
hm1.Colormap = new ScottPlot.Colormaps.Turbo();
myPlot.Add.ColorBar(hm1);

var hm2 = myPlot.Add.Heatmap(data);
hm2.Rectangle = new(1.5, 2.5, 0, 1);
hm2.Colormap = new ScottPlot.Colormaps.Viridis();
myPlot.Add.ColorBar(hm2);

myPlot.SavePng("demo.png", 400, 300);
カラーバーのタイトル
カラーバーのタイトル
カラーバーはプロットの端にカラーマップを表示するもので、タイトルを表示するようにカスタマイズできる任意のラベルを持ちます。
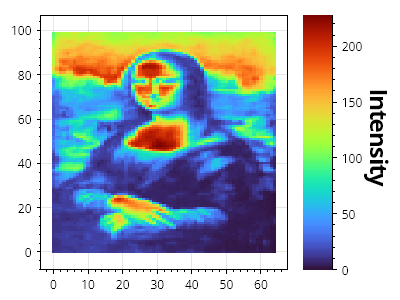
ScottPlot.Plot myPlot = new();

double[,] data = SampleData.MonaLisa();

var hm = myPlot.Add.Heatmap(data);
hm.Colormap = new ScottPlot.Colormaps.Turbo();

var cb = myPlot.Add.ColorBar(hm);
cb.Label = "Intensity";
cb.LabelStyle.FontSize = 24;

myPlot.SavePng("demo.png", 400, 300);
カラーバーの目盛りフォーマッター
カラーバーの目盛りフォーマッター
カラーバーには、ユーザーが目盛りラベルの文字列形式を制御できる、オプションのカスタム目盛りフォーマッターがあります。
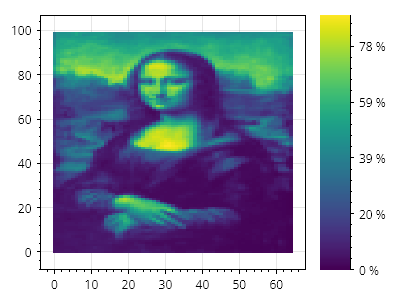
ScottPlot.Plot myPlot = new();

double[,] data = SampleData.MonaLisa();

var hm = myPlot.Add.Heatmap(data);
var cb = myPlot.Add.ColorBar(hm);
cb.MinimumSize = 80; // カラーバーと目盛りラベルのためのスペースを確保する

// 文字列フォーマットのロジックを含む静的関数を作成する
static string CustomFormatter(double position)
{
    return $"{Math.Round(position / 2.55)} %";
}

// カスタムラベルフォーマッターを使用してカスタム目盛りジェネレーターを作成する
ScottPlot.TickGenerators.NumericAutomatic myTickGenerator = new()
{
    LabelFormatter = CustomFormatter
};

// カラーバーにカスタム目盛りジェネレーターを使用するよう指示する
cb.Axis.TickGenerator = myTickGenerator;

myPlot.SavePng("demo.png", 400, 300);
反転ヒートマップ
反転ヒートマップ
ヒートマップは水平方向および/または垂直方向に反転できます
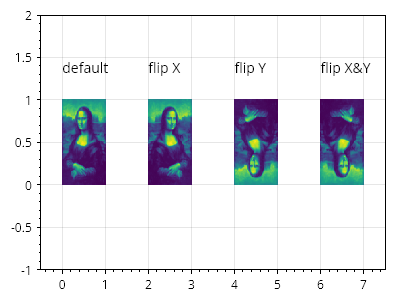
ScottPlot.Plot myPlot = new();

double[,] data = SampleData.MonaLisa();

myPlot.Add.Text("デフォルト", 0, 1.5);
var hm1 = myPlot.Add.Heatmap(data);
hm1.Position = new CoordinateRect(0, 1, 0, 1);

myPlot.Add.Text("X 反転", 2, 1.5);
var hm2 = myPlot.Add.Heatmap(data);
hm2.Position = new CoordinateRect(2, 3, 0, 1);
hm2.FlipHorizontally = true;

myPlot.Add.Text("Y 反転", 4, 1.5);
var hm3 = myPlot.Add.Heatmap(data);
hm3.Position = new CoordinateRect(4, 5, 0, 1);
hm3.FlipVertically = true;

myPlot.Add.Text("X&Y 反転", 6, 1.5);
var hm4 = myPlot.Add.Heatmap(data);
hm4.Position = new CoordinateRect(6, 7, 0, 1);
hm4.FlipHorizontally = true;
hm4.FlipVertically = true;

myPlot.Axes.SetLimits(-.5, 7.5, -1, 2);

myPlot.SavePng("demo.png", 400, 300);
滑らかなヒートマップ
滑らかなヒートマップ
アンチエイリアスされたレンダリングを行うには、Smooth プロパティを有効にします
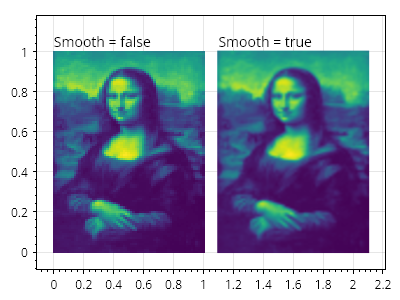
ScottPlot.Plot myPlot = new();

double[,] data = SampleData.MonaLisa();

myPlot.Add.Text("Smooth = false", 0, 1.1);
var hm1 = myPlot.Add.Heatmap(data);
hm1.Position = new CoordinateRect(0, 1, 0, 1);

myPlot.Add.Text("Smooth = true", 1.1, 1.1);
var hm2 = myPlot.Add.Heatmap(data);
hm2.Position = new CoordinateRect(1.1, 2.1, 0, 1);
hm2.Smooth = true;

myPlot.SavePng("demo.png", 400, 300);
透明なセル
透明なセル
ヒートマップのセルに double.NaN を代入すると、そのセルを透明にできます。
![]()
ScottPlot.Plot myPlot = new();

// 2Dデータから始め、いくつかのセルをNaNに設定する
double[,] data = SampleData.MonaLisa();
for (int y = 20; y < 80; y++)
{
    for (int x = 20; x < 60; x++)
    {
        data[y, x] = double.NaN;
    }
}

// 折れ線グラフを作成する
myPlot.Add.Signal(Generate.Sin());
myPlot.Add.Signal(Generate.Cos());

// 折れ線グラフの上にヒートマップをプロットする
var hm1 = myPlot.Add.Heatmap(data);
hm1.Position = new(10, 35, -1.5, .5);

// NaNの透明色はカスタマイズできる
var hm2 = myPlot.Add.Heatmap(data);
hm2.Position = new(40, 55, -.5, .75);
hm2.NaNCellColor = Colors.Magenta.WithAlpha(.4);

myPlot.SavePng("demo.png", 400, 300);
グローバル透明度
グローバル透明度
ヒートマップ全体の透明度を調整できます。
![]()
ScottPlot.Plot myPlot = new();
double[,] data = SampleData.MonaLisa();
// 折れ線グラフを作成する
myPlot.Add.Signal(Generate.Sin());
myPlot.Add.Signal(Generate.Cos());
// 折れ線グラフの上にヒートマップをプロットする
var hm = myPlot.Add.Heatmap(data);
hm.Position = new(10, 35, -1.5, .5);
hm.Opacity = 0.5;
myPlot.SavePng("demo.png", 400, 300);
アルファマップ
アルファマップ
アルファマップ(バイト値の2次元配列)を使用すると、ヒートマップの各セルにカスタムの透明度を適用できます。
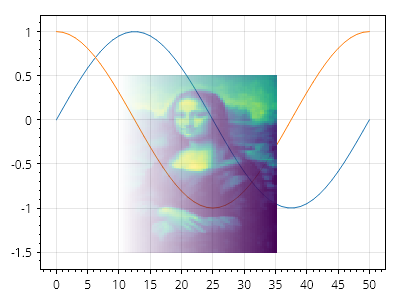
ScottPlot.Plot myPlot = new();
// データ値はヒートマップのカラーマップに基づいて色に変換されます
double[,] data = SampleData.MonaLisa();
// アルファマップは各セルの透明度を制御します
byte[,] alphaMap = new byte[data.GetLength(0), data.GetLength(1)];
// アルファマップに 0(透明)から 255(不透明)までの値を設定します
for (int y = 0; y < alphaMap.GetLength(0); y++)
{
for (int x = 0; x < alphaMap.GetLength(1); x++)
{
double fractionAcross = (double)x / alphaMap.GetLength(1);
alphaMap[y, x] = (byte)(fractionAcross * 255);
}
}
// 折れ線グラフを作成します
myPlot.Add.Signal(Generate.Sin());
myPlot.Add.Signal(Generate.Cos());
// 折れ線グラフの上にヒートマップをプロットします
var hm = myPlot.Add.Heatmap(data);
hm.Position = new(10, 35, -1.5, .5);
hm.AlphaMap = alphaMap;
myPlot.SavePng("demo.png", 400, 300);
フレームレスヒートマップ
フレームレスヒートマップ
フレームレスヒートマップは、軸ラベルと目盛りを無効化し、余白を 0 に設定してデータ領域がデータにぴったり合うようにすることで実現できます。

ScottPlot.Plot myPlot = new();
double[,] data = {
{ 1, 2, 3 },
{ 4, 5, 6 },
{ 7, 8, 9 },
};
// プロットにヒートマップを追加する
myPlot.Add.Heatmap(data);
// 図のすべての端の軸を非表示にする
myPlot.Layout.Frameless();
// ヒートマップデータの周囲のパディングを無効化する
myPlot.Axes.Margins(0, 0);
myPlot.SavePng("demo.png", 400, 300);
HeatmapCellAlignment
HeatmapCellAlignment
ヒートマップのセルは、デフォルトで中央に配置されます。これは、左下のセルが (0, 0) を中心とし、その左下隅が原点の左下に位置することを意味します。セル配置を左下に設定すると、ヒートマップの左下が正確に (0, 0) になります。
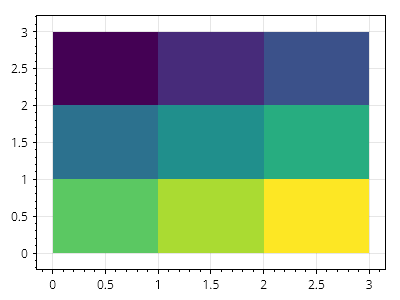
ScottPlot.Plot myPlot = new();
double[,] data = {
{ 1, 2, 3 },
{ 4, 5, 6 },
{ 7, 8, 9 },
};
var hm = myPlot.Add.Heatmap(data);
hm.CellAlignment = Alignment.LowerLeft;
myPlot.SavePng("demo.png", 400, 300);
ヒートマップのセルサイズ
ヒートマップのセルサイズ
ヒートマップの寸法は、セルの大きさをピクセル単位で指定することで設定できます。
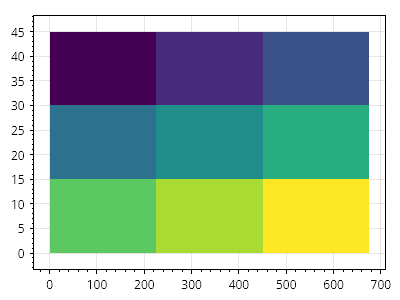
ScottPlot.Plot myPlot = new();
double[,] data = {
{ 1, 2, 3 },
{ 4, 5, 6 },
{ 7, 8, 9 },
};
var hm = myPlot.Add.Heatmap(data);
hm.CellAlignment = Alignment.LowerLeft;
hm.CellWidth = 100;
hm.CellHeight = 10;
myPlot.SavePng("demo.png", 400, 300);
ヒートマップの矩形
ヒートマップの矩形
ヒートマップの寸法は、ヒートマップがその内部にレンダリングされる矩形を定義することで設定できます。
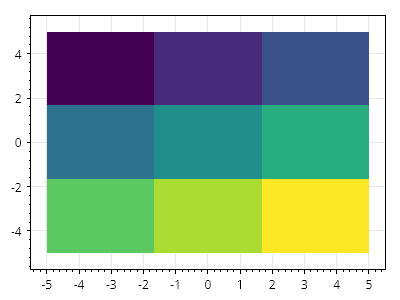
ScottPlot.Plot myPlot = new();
// 任意のサイズのヒートマップを作成する
double[,] data = {
{ 1, 2, 3 },
{ 4, 5, 6 },
{ 7, 8, 9 },
};
// ヒートマップをプロットに追加する
var hm = myPlot.Add.Heatmap(data);
// 座標空間で定義された矩形内にヒートマップを配置する
hm.Rectangle = new CoordinateRect(-5, 5, -5, 5);
myPlot.SavePng("demo.png", 400, 300);
手動カラーレンジ付きヒートマップ
手動カラーレンジ付きヒートマップ
ユーザーは、カラーマップで色として表現する値の範囲を定義できます。その範囲外の値は、カラーマップ内の最も近い色にクリップされます。
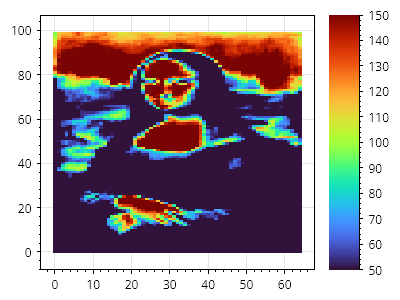
ScottPlot.Plot myPlot = new();
// サンプルデータの値の範囲は 0~255
double[,] data = SampleData.MonaLisa();
// ヒートマップとカラーバーをプロットに追加する
var hm = myPlot.Add.Heatmap(data);
hm.Colormap = new ScottPlot.Colormaps.Turbo();
myPlot.Add.ColorBar(hm);
// カラーマップが手動の値範囲にまたがるように強制する
hm.ManualRange = new(50, 150);
myPlot.SavePng("demo.png", 400, 300);
ヒートマップのセルラベル
ヒートマップのセルラベル
セル上にテキストを配置して、セルラベルを提供できます。インタラクティブなアプリケーションでは、MouseMove イベントを使用して古いラベルを削除し、マウスの下にあるセル上にのみラベルを表示できます。詳細とコードサンプルについては、ScottPlot Demo ページを参照してください。

ScottPlot.Plot myPlot = new();
double[,] data = {
{ 1, 2, 3 },
{ 4, 5, 6 },
{ 7, 8, 9 },
};
var hm = myPlot.Add.Heatmap(data);
for (int y = 0; y < data.GetLength(0); y++)
{
for (int x = 0; x < data.GetLength(1); x++)
{
Coordinates coordinates = new(x, y);
string cellLabel = data[y, x].ToString("0.0");
var text = myPlot.Add.Text(cellLabel, coordinates);
text.Alignment = Alignment.MiddleCenter;
text.LabelFontSize = 30;
text.LabelFontColor = Colors.White;
}
}
myPlot.SavePng("demo.png", 400, 300);
DateTime 軸を使用したヒートマップ
DateTime 軸を使用したヒートマップ
ヒートマップは、水平軸に数値ではなく日付を使用するプロットに表示できます。
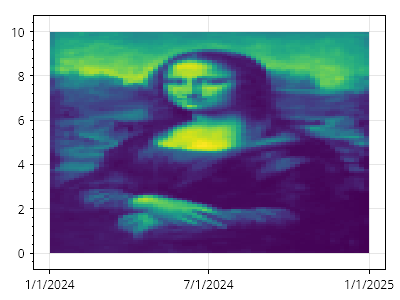
ScottPlot.Plot myPlot = new();
// プロットにヒートマップを追加する
double[,] data = SampleData.MonaLisa();
var hm = myPlot.Add.Heatmap(data);
// 数値単位を使用してその高さを定義する
CoordinateRange yRange = new(0, 10);
// 日付単位を使用してその幅を定義する
DateTime start = new(2024, 01, 01);
DateTime end = new(2025, 01, 01);
CoordinateRange xRange = new(start.ToOADate(), end.ToOADate());
// ヒートマップに幅と高さを適用する
hm.Rectangle = new(xRange, yRange);
// X 軸の目盛りラベルに日付形式を使用するようプロットに指示する
myPlot.Axes.DateTimeTicksBottom();
myPlot.SavePng("demo.png", 400, 300);
画像
Images can be placed on plots in a variety of ways
レシピ
画像の矩形
画像の矩形
画像は、座標単位で定義された矩形の内側に描画できます。
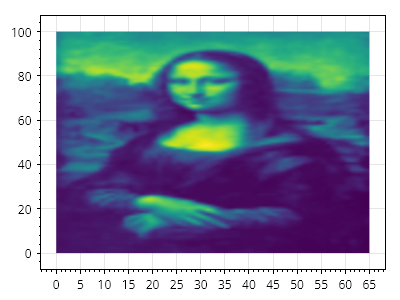
ScottPlot.Plot myPlot = new();
// 画像はファイルから読み込むことも、動的に作成することもできます
ScottPlot.Image img = ScottPlot.SampleImages.MonaLisa();
CoordinateRect rect = new(left: 0, right: img.Width, bottom: 0, top: img.Height);
myPlot.Add.ImageRect(img, rect);
myPlot.SavePng("demo.png", 400, 300);
インタラクティブ
Interactive plottables interact with the mouse without requiring the user to manually wire mouse tracking.
レシピ
- インタラクティブな線分
- インタラクティブな水平線分
- インタラクティブな垂直線分
- インタラクティブな垂直線
- インタラクティブな水平線
- インタラクティブなスパン
- インタラクティブマーカー
- インタラクティブな四角形
インタラクティブな線分
インタラクティブな線分
2つのドラッグ可能な点と、その間を結ぶ直線です。
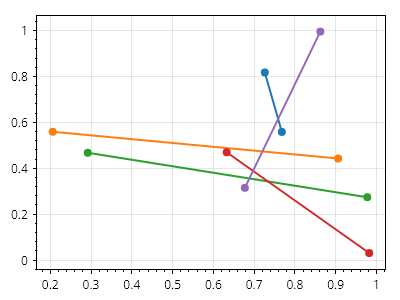
ScottPlot.Plot myPlot = new();
for (int i = 0; i < 5; i++)
{
CoordinateLine line = Generate.RandomLine();
myPlot.Add.InteractiveLineSegment(line);
}
myPlot.SavePng("demo.png", 400, 300);
インタラクティブな水平線分
インタラクティブな水平線分
水平線分は、左端と右端をドラッグすることで水平方向に拡張したり、中心線をドラッグすることで垂直方向にスライドしたりできます。
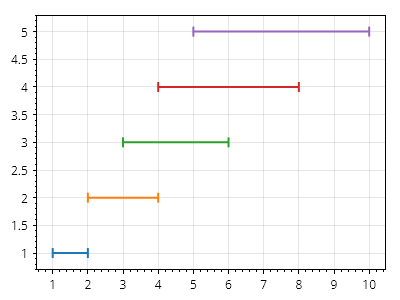
ScottPlot.Plot myPlot = new();
for (int i = 1; i <= 5; i++)
{
double y = i;
double x1 = i;
double x2 = i * 2;
myPlot.Add.InteractiveHorizontalLineSegment(x1, x2, y);
}
myPlot.SavePng("demo.png", 400, 300);
インタラクティブな垂直線分
インタラクティブな垂直線分
垂直線分は、上端と下端をドラッグすることで垂直方向に拡張したり、中心線をドラッグすることで水平方向にスライドしたりできます。
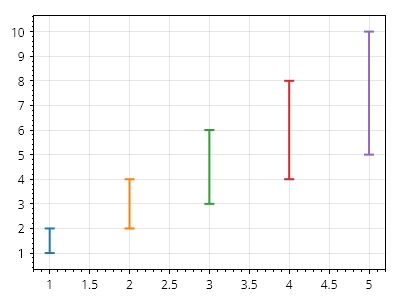
ScottPlot.Plot myPlot = new();
for (int i = 1; i <= 5; i++)
{
double x = i;
double y1 = i;
double y2 = i * 2;
myPlot.Add.InteractiveVerticalLineSegment(x, y1, y2);
}
myPlot.SavePng("demo.png", 400, 300);
インタラクティブな垂直線
インタラクティブな垂直線
インタラクティブな垂直線は X 位置を持ち、Y 軸方向に無限に延びます。
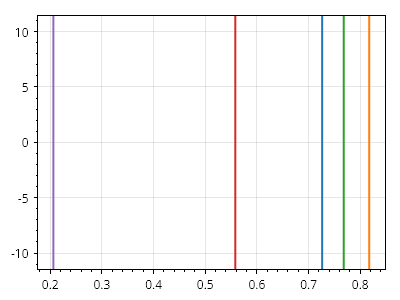
ScottPlot.Plot myPlot = new();
for (int i = 0; i < 5; i++)
{
double x = Generate.RandomNumber();
myPlot.Add.InteractiveVerticalLine(x);
}
myPlot.SavePng("demo.png", 400, 300);
インタラクティブな水平線
インタラクティブな水平線
インタラクティブな水平線は Y 位置を持ち、X 軸に沿って無限に伸びます。
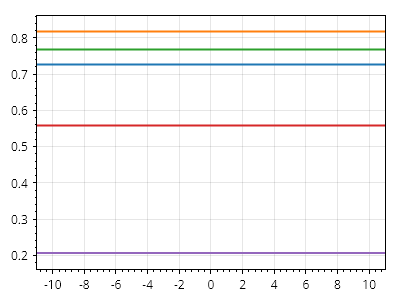
ScottPlot.Plot myPlot = new();
for (int i = 0; i < 5; i++)
{
double x = Generate.RandomNumber();
myPlot.Add.InteractiveHorizontalLine(x);
}
myPlot.SavePng("demo.png", 400, 300);
インタラクティブなスパン
インタラクティブなスパン
インタラクティブな垂直スパンと水平スパンにより、ユーザーはそれぞれ垂直軸と水平軸に沿った範囲を選択できます。
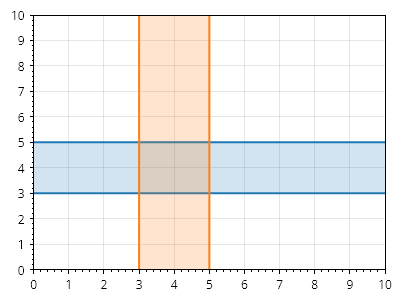
ScottPlot.Plot myPlot = new();
myPlot.Add.InteractiveVerticalSpan(3, 5);
myPlot.Add.InteractiveHorizontalSpan(3, 5);
myPlot.Axes.SetLimits(0, 10, 0, 10);
myPlot.SavePng("demo.png", 400, 300);
インタラクティブマーカー
インタラクティブマーカー
インタラクティブマーカーはホバーイベントに応答し、ドラッグできます。
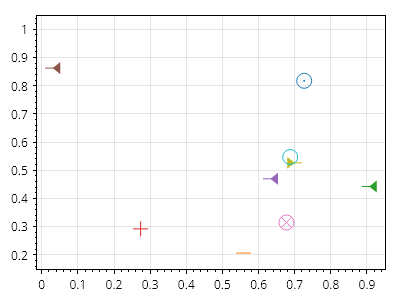
ScottPlot.Plot myPlot = new();
for (int i = 0; i < 10; i++)
{
Coordinates point = Generate.RandomCoordinates();
var marker = myPlot.Add.InteractiveMarker(point);
marker.MarkerStyle.Shape = Generate.RandomMarkerShape();
}
myPlot.SavePng("demo.png", 400, 300);
インタラクティブな四角形
インタラクティブな四角形
インタラクティブな四角形は、辺をドラッグしてサイズ変更したり、本体をドラッグして位置変更したりできます
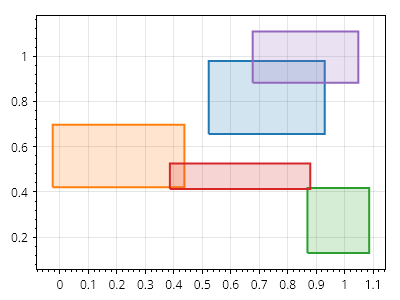
ScottPlot.Plot myPlot = new();
for (int i = 0; i < 5; i++)
{
CoordinateRect rect = Generate.RandomCoordinateRect();
myPlot.Add.InteractiveRectangle(rect);
}
myPlot.SavePng("demo.png", 400, 300);
ラインプロット
Line plots can be placed on the plot in coordinate space using a Start, End, and an optional LineStyle.
レシピ
ラインプロットのクイックスタート
ラインプロットのクイックスタート
ラインプロットは、座標空間内の開始位置と終了位置を指定して配置されます。スタイルはカスタマイズできます。
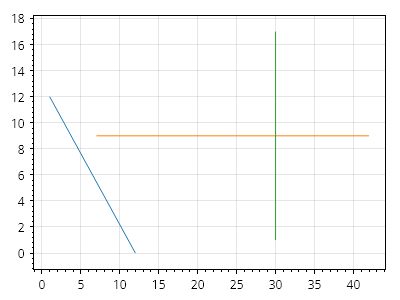
ScottPlot.Plot myPlot = new();
myPlot.Add.Line(1, 12, 12, 0);
myPlot.Add.Line(7, 9, 42, 9);
myPlot.Add.Line(30, 17, 30, 1);
myPlot.SavePng("demo.png", 400, 300);
ラインプロットの形状
ラインプロットの形状
ラインプロットは LineStyle を使用してスタイル設定できます。
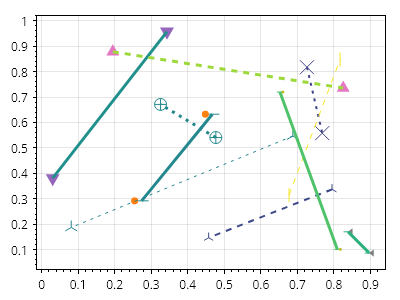
ScottPlot.Plot myPlot = new();
ScottPlot.Colormaps.Viridis colormap = new();
for (int i = 0; i < 10; i++)
{
// ラインを追加する
Coordinates start = Generate.RandomCoordinates();
Coordinates end = Generate.RandomCoordinates();
var line = myPlot.Add.Line(start, end);
// ラインをカスタマイズする
line.LineColor = Generate.RandomColor(colormap);
line.LineWidth = Generate.RandomInteger(1, 4);
line.LinePattern = Generate.RandomLinePattern();
// マーカーをカスタマイズする
line.MarkerLineColor = line.LineStyle.Color;
line.MarkerShape = Generate.RandomMarkerShape();
line.MarkerSize = Generate.RandomInteger(5, 15);
}
myPlot.SavePng("demo.png", 400, 300);
折れ線プロットの凡例
折れ線プロットの凡例
ラベル付きの折れ線プロットは凡例に表示されます。
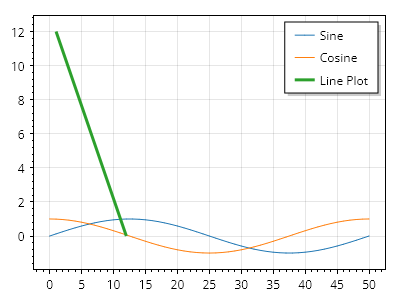
ScottPlot.Plot myPlot = new();
var sin = myPlot.Add.Signal(Generate.Sin());
sin.LegendText = "正弦";
var cos = myPlot.Add.Signal(Generate.Cos());
cos.LegendText = "余弦";
var line = myPlot.Add.Line(1, 12, 12, 0);
line.LineWidth = 3;
line.MarkerSize = 10;
line.LegendText = "折れ線プロット";
myPlot.ShowLegend(Alignment.UpperRight);
myPlot.SavePng("demo.png", 400, 300);
線とマーカーの順序
線とマーカーの順序
マーカーは線の端に表示できます。また、マーカーを線の上に描画するか下に描画するかをフラグで制御します。
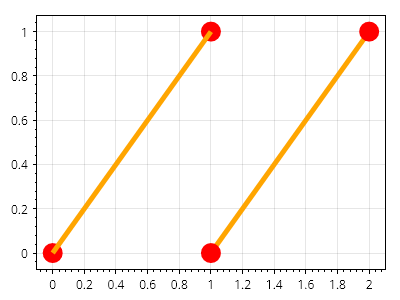
ScottPlot.Plot myPlot = new();
var line1 = myPlot.Add.Line(0, 0, 1, 1);
line1.LineColor = Colors.Orange;
line1.LineWidth = 5;
line1.MarkerColor = Colors.Red;
line1.MarkerSize = 20;
line1.MarkerShape = MarkerShape.FilledCircle;
line1.LineOnTop = true; // 描画順序はここで制御されます
var line2 = myPlot.Add.Line(1, 0, 2, 1);
line2.LineColor = Colors.Orange;
line2.LineWidth = 5;
line2.MarkerColor = Colors.Red;
line2.MarkerSize = 20;
line2.MarkerShape = MarkerShape.FilledCircle;
line2.MarkersOnTop = true; // 描画順序はここで制御されます
myPlot.SavePng("demo.png", 400, 300);
ライブデータ
Plottables like DataLogger and DataStreamer are designed for displaying datasets that change in real time. They have the ability to control axis limits to ensure the latest data is always in view. See the ScottPlot Demo for live example of these plot types.
レシピ
DataLogger クイックスタート
DataLogger クイックスタート
DataLogger を使用して、増大していくデータセット(センサーデータなど)を表示します。このプロットタイプは、新しいデータが常に既存データの末尾に追加されることを前提としているため、SignalXY と同様に、新しいデータ点の X 値は前の値以上でなければなりません。このプロットタイプのライブ例については、ScottPlot Demo を参照してください。
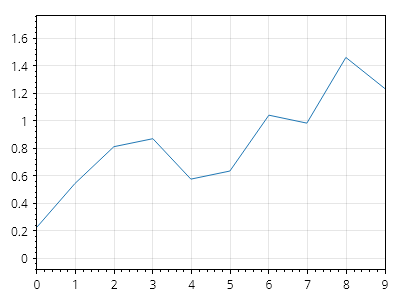
ScottPlot.Plot myPlot = new();
// データが追加されるにつれて拡張されるロガーを設定する
var logger = myPlot.Add.DataLogger();
// ライブデータのストリーミング入力をシミュレートする
for (int x = 0; x < 10; x++)
{
double y = Generate.RandomWalker.Next();
logger.Add(x, y);
}
myPlot.SavePng("demo.png", 400, 300);
DataStreamer クイックスタート
DataStreamer クイックスタート
DataStreamer を使用すると、ポイント間の水平距離が固定された固定長表示でストリーミングデータを表示できます。この種類のプロットは、ECG(心電図モニター)波形のような信号に最適です。このプロットタイプには、新しいデータが古いデータをどのように置き換えるかを制御する高度なカスタマイズがあります(例: 右側に新しいデータが表示されるにつれて古いデータを左にスライドさせる、または新しいデータ値を左から右に配置し、その後先頭に折り返して、再び左から右に置き換えることで最も古いデータ値を消去する)。このプロットタイプのライブ例については、ScottPlot Demo を参照してください。
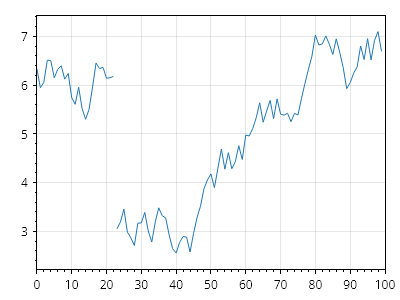
ScottPlot.Plot myPlot = new();
// 最新の100ポイントを表示するストリーマーをセットアップする
var streamer = myPlot.Add.DataStreamer(100);
// ライブデータのストリーミング入力をシミュレートする。
for (int x = 0; x < 123; x++)
{
double y = Generate.RandomWalker.Next();
streamer.Add(y);
}
// 新しいデータが古いデータを左から右に上書きするように指示する
streamer.ViewWipeRight();
myPlot.SavePng("demo.png", 400, 300);
DataLogger の編集
DataLogger の編集
データロガーによって蓄積された値は、取得後に編集できます。
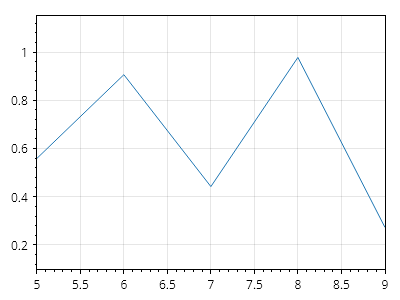
ScottPlot.Plot myPlot = new();
// データが追加されるにつれて増加するロガーを設定する
var logger = myPlot.Add.DataLogger();
// 10 個の値を追加する
logger.Add(Generate.RandomSample(10));
// 最も古い 5 個の値を削除する
logger.Data.Coordinates.RemoveRange(0, 5);
myPlot.SavePng("demo.png", 400, 300);
Lollipopプロット
A lollipop chart is a variation of a bar chart that uses a line (stem) extending from a baseline to a marker (head) to represent data points. Lollipop highlight individual data points with less visual clutter than to traditional bar charts.
レシピ
ロリポッププロットのクイックスタート
ロリポッププロットのクイックスタート
ロリポッププロットは、値のシーケンスから作成できます
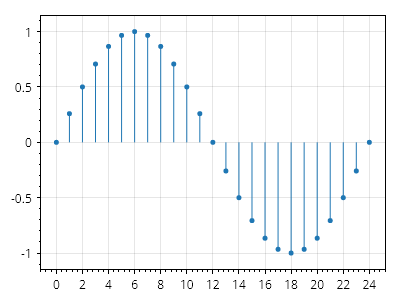
ScottPlot.Plot myPlot = new();
double[] values = Generate.Sin(25);
myPlot.Add.Lollipop(values);
myPlot.SavePng("demo.png", 400, 300);
ロリポップの位置
ロリポップの位置
各ロリポップの位置を定義できます。
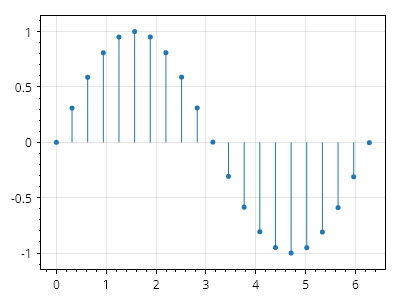
ScottPlot.Plot myPlot = new();
double[] xs = Generate.Range(0, 6.28, 0.314);
double[] ys = xs.Select(Math.Sin).ToArray();
var lollipop = myPlot.Add.Lollipop(ys, xs);
myPlot.SavePng("demo.png", 400, 300);
ロリポッププロットのカスタマイズ
ロリポッププロットのカスタマイズ
ステムラインとヘッドマーカーは、広範にカスタマイズできます。
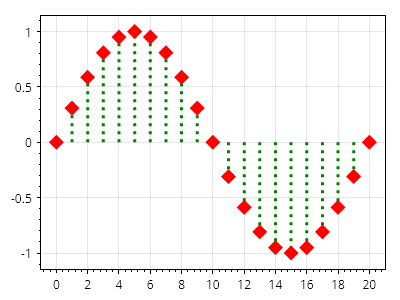
ScottPlot.Plot myPlot = new();
double[] values = Generate.Sin(21);
var lollipop = myPlot.Add.Lollipop(values);
lollipop.MarkerColor = Colors.Red;
lollipop.MarkerSize = 15;
lollipop.MarkerShape = MarkerShape.FilledDiamond;
lollipop.LineColor = Colors.Green;
lollipop.LineWidth = 3;
lollipop.LinePattern = LinePattern.Dotted;
myPlot.SavePng("demo.png", 400, 300);
水平ロリポッププロット
水平ロリポッププロット
ロリポッププロットの Orientation を Horizontal に変更すると、ステムが垂直方向ではなく水平方向に描画されます。
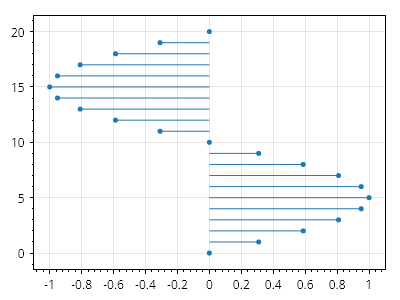
ScottPlot.Plot myPlot = new();
double[] xs = Generate.Sin(21);
double[] ys = Generate.Consecutive(21);
Coordinates[] coordinates = Coordinates.Zip(xs, ys);
var lollipop = myPlot.Add.Lollipop(coordinates);
lollipop.Orientation = Orientation.Horizontal;
myPlot.SavePng("demo.png", 400, 300);
マーカー
Markers can be placed on the plot in coordinate space.
レシピ
Marker クイックスタート
Marker クイックスタート
マーカーは、座標空間内の位置に配置されるシンボルです。その形状、サイズ、色はカスタマイズできます。
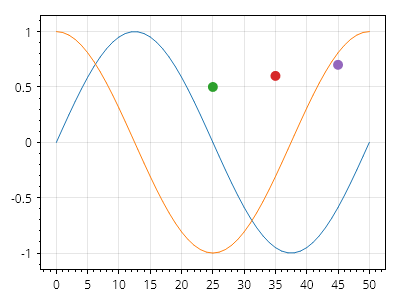
ScottPlot.Plot myPlot = new();
myPlot.Add.Signal(Generate.Sin());
myPlot.Add.Signal(Generate.Cos());
myPlot.Add.Marker(25, .5);
myPlot.Add.Marker(35, .6);
myPlot.Add.Marker(45, .7);
myPlot.SavePng("demo.png", 400, 300);
マーカー形状
マーカー形状
標準のマーカー形状が用意されていますが、上級ユーザーは独自の形状を作成することもできます。
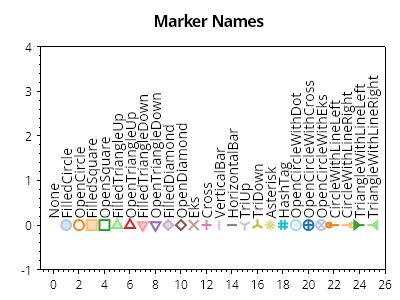
ScottPlot.Plot myPlot = new();
MarkerShape[] markerShapes = Enum.GetValues<MarkerShape>().ToArray();
ScottPlot.Palettes.Category20 palette = new();
for (int i = 0; i < markerShapes.Length; i++)
{
var mp = myPlot.Add.Marker(x: i, y: 0);
mp.MarkerStyle.Shape = markerShapes[i];
mp.MarkerStyle.Size = 10;
// 塗りつぶし形状で作成されたマーカーはカスタマイズできます
mp.MarkerStyle.FillColor = palette.GetColor(i).WithAlpha(.5);
// 塗りつぶし形状で作成されたマーカーには、任意でアウトラインを付けられます
mp.MarkerStyle.OutlineColor = palette.GetColor(i);
mp.MarkerStyle.OutlineWidth = 2;
// 線で作成されたマーカーはカスタマイズできます
mp.MarkerStyle.LineWidth = 2f;
mp.MarkerStyle.LineColor = palette.GetColor(i);
var txt = myPlot.Add.Text(markerShapes[i].ToString(), i, 0.15);
txt.LabelRotation = -90;
txt.LabelAlignment = Alignment.MiddleLeft;
txt.LabelFontColor = Colors.Black;
}
myPlot.Title("マーカー名");
myPlot.Axes.SetLimits(-1, markerShapes.Length, -1, 4);
myPlot.HideGrid();
myPlot.SavePng("demo.png", 400, 300);
マーカーの凡例
マーカーの凡例
ラベル付きのマーカーは凡例に表示されます。
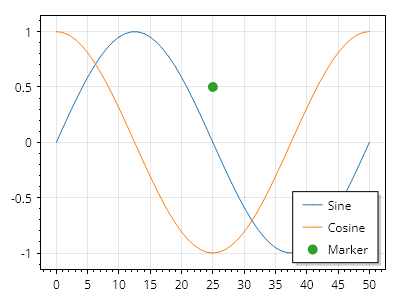
ScottPlot.Plot myPlot = new();
var sin = myPlot.Add.Signal(Generate.Sin());
sin.LegendText = "正弦";
var cos = myPlot.Add.Signal(Generate.Cos());
cos.LegendText = "余弦";
var marker = myPlot.Add.Marker(25, .5);
marker.LegendText = "マーカー";
myPlot.ShowLegend();
myPlot.SavePng("demo.png", 400, 300);
多数のマーカー
多数のマーカー
すべて同じスタイルが設定されたマーカーのコレクションをプロットに追加できます
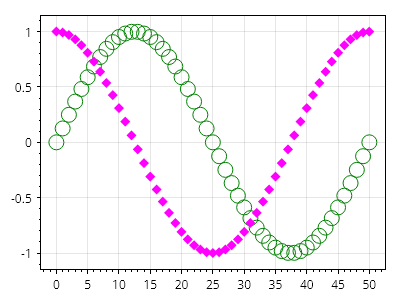
ScottPlot.Plot myPlot = new();
double[] xs = Generate.Consecutive(51);
double[] sin = Generate.Sin(51);
double[] cos = Generate.Cos(51);
myPlot.Add.Markers(xs, sin, MarkerShape.OpenCircle, 15, Colors.Green);
myPlot.Add.Markers(xs, cos, MarkerShape.FilledDiamond, 10, Colors.Magenta);
myPlot.SavePng("demo.png", 400, 300);
カラーマップ付きマーカー
カラーマップ付きマーカー
カラーマップを使用してマーカーのコレクションのスタイルを設定できます
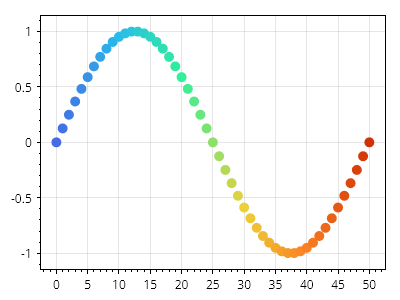
ScottPlot.Plot myPlot = new();
double[] xs = Generate.Consecutive(51);
double[] ys = Generate.Sin(51);
var markers = myPlot.Add.Markers(xs, ys);
markers.Colormap = new ScottPlot.Colormaps.MellowRainbow();
myPlot.SavePng("demo.png", 400, 300);
画像マーカー
画像マーカー
ImageMarker はプロット上に配置でき、座標空間内の位置を中心として画像を表示できます。
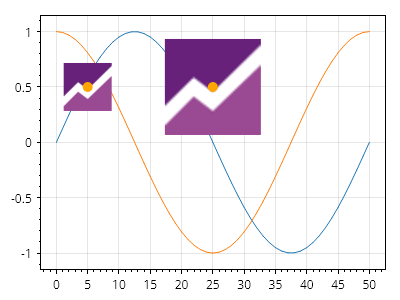
ScottPlot.Plot myPlot = new();
myPlot.Add.Signal(Generate.Sin());
myPlot.Add.Signal(Generate.Cos());
// 画像はファイルから読み込むことも、動的に作成することもできます
ScottPlot.Image image = SampleImages.ScottPlotLogo(48, 48);
Coordinates location1 = new(5, .5);
Coordinates location2 = new(25, .5);
myPlot.Add.ImageMarker(location1, image);
myPlot.Add.ImageMarker(location2, image, scale: 2);
var m1 = myPlot.Add.Marker(location1);
var m2 = myPlot.Add.Marker(location2);
m1.Color = Colors.Orange;
m2.Color = Colors.Orange;
myPlot.SavePng("demo.png", 400, 300);
線のみのマーカー
線のみのマーカー
線のみで構成されるマーカーには塗りつぶしプロパティがありません。
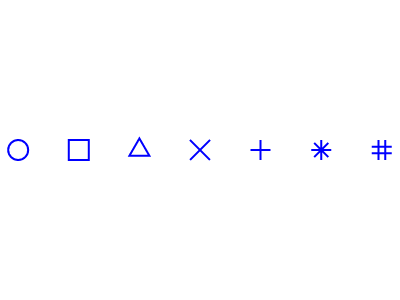
ScottPlot.Plot myPlot = new();
MarkerShape[] lineOnlyMarkerShapes = [
MarkerShape.OpenCircle,
MarkerShape.OpenSquare,
MarkerShape.OpenTriangleUp,
MarkerShape.Eks,
MarkerShape.Cross,
MarkerShape.Asterisk,
MarkerShape.HashTag,
];
for (int i = 0; i < lineOnlyMarkerShapes.Length; i++)
{
var marker = myPlot.Add.Marker(i, 0, lineOnlyMarkerShapes[i]);
// 線のみのマーカーには線のカスタマイズオプションがあります
marker.MarkerLineColor = Colors.Blue;
marker.LineWidth = 2;
marker.MarkerSize = 20;
// 線のみのマーカーは塗りつぶしプロパティの変更による影響を受けません
marker.MarkerFillColor = Colors.Green;
}
myPlot.Layout.Frameless();
myPlot.HideGrid();
myPlot.SavePng("demo.png", 400, 300);
塗りつぶし付きマーカー
塗りつぶし付きマーカー
塗りつぶし付きマーカーはカスタマイズに対応しています。
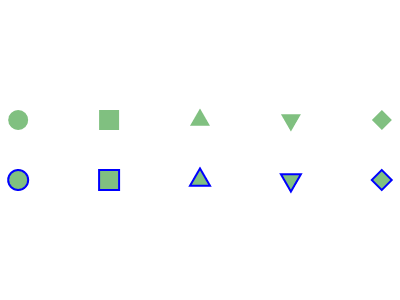
ScottPlot.Plot myPlot = new();
MarkerShape[] filledMarkerShapes = [
MarkerShape.FilledCircle,
MarkerShape.FilledSquare,
MarkerShape.FilledTriangleUp,
MarkerShape.FilledTriangleDown,
MarkerShape.FilledDiamond,
];
for (int i = 0; i < filledMarkerShapes.Length; i++)
{
var markerFill = myPlot.Add.Marker(i, 1, filledMarkerShapes[i]);
markerFill.MarkerSize = 20;
var markerFillAndOutline = myPlot.Add.Marker(i, -1, filledMarkerShapes[i]);
markerFillAndOutline.MarkerSize = 20;
// 塗りつぶし付きマーカーには、カスタマイズ可能な塗りつぶし色があります
markerFill.MarkerFillColor = Colors.Green.WithAlpha(.5);
markerFillAndOutline.MarkerFillColor = Colors.Green.WithAlpha(.5);
// 塗りつぶし付きマーカーにはアウトラインを付けることができます
markerFillAndOutline.MarkerLineColor = Colors.Blue;
markerFillAndOutline.LineWidth = 2;
}
myPlot.Layout.Frameless();
myPlot.HideGrid();
myPlot.Axes.SetLimitsY(-5, 5);
myPlot.SavePng("demo.png", 400, 300);
フェーザープロット
Phasor plots display vectors on a radial axis centered at the origin
レシピ
フェーザ線プロット
フェーザ線プロット
フェーザ線プロットには、矢印としてレンダリングされる極座標のコレクションが含まれます。
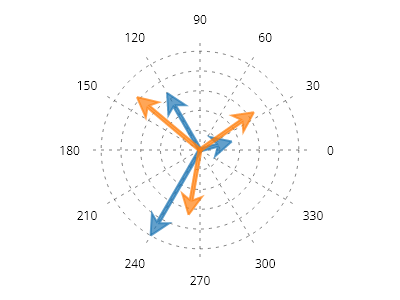
ScottPlot.Plot myPlot = new();
// まずプロット上に極座標軸システムを配置します
var polarAxis = myPlot.Add.PolarAxis(30);
polarAxis.Circles.ForEach(x => x.LinePattern = LinePattern.Dotted);
polarAxis.Spokes.ForEach(x => x.LinePattern = LinePattern.Dotted);
// Phasor は事前定義された点で追加できます
PolarCoordinates[] points1 = [
new(10, Angle.FromDegrees(15)),
new(20, Angle.FromDegrees(120)),
new(30, Angle.FromDegrees(240)),
];
myPlot.Add.Phasor(points1);
// Phasor 上の点は、作成後に追加または変更できます
var phaser2 = myPlot.Add.Phasor();
phaser2.Points.Add(new PolarCoordinates(20, Angle.FromDegrees(35)));
phaser2.Points.Add(new PolarCoordinates(25, Angle.FromDegrees(140)));
phaser2.Points.Add(new PolarCoordinates(20, Angle.FromDegrees(260)));
myPlot.SavePng("demo.png", 400, 300);
ラベル付きフェーザープロット
ラベル付きフェーザープロット
テキストラベルは、フェーザープロットの個々の矢印に適用できます。
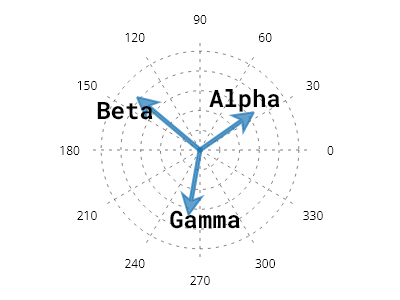
ScottPlot.Plot myPlot = new();
// 極軸をセットアップする
var polarAxis = myPlot.Add.PolarAxis(30);
polarAxis.Circles.ForEach(x => x.LinePattern = LinePattern.Dotted);
polarAxis.Spokes.ForEach(x => x.LinePattern = LinePattern.Dotted);
// フェーザープロットと座標空間内の点を作成する
var phaser = myPlot.Add.Phasor();
phaser.Points.Add(new PolarCoordinates(20, Angle.FromDegrees(35)));
phaser.Points.Add(new PolarCoordinates(25, Angle.FromDegrees(140)));
phaser.Points.Add(new PolarCoordinates(20, Angle.FromDegrees(260)));
// 点のラベルを追加する
phaser.Labels.Add("Alpha");
phaser.Labels.Add("Beta");
phaser.Labels.Add("Gamma");
// ラベルのスタイルを設定する
phaser.LabelStyle.FontSize = 24;
phaser.LabelStyle.ForeColor = Colors.Black;
phaser.LabelStyle.FontName = Fonts.Monospace;
phaser.LabelStyle.Bold = true;
myPlot.SavePng("demo.png", 400, 300);
円グラフ
Pie charts illustrate numerical proportions as slices of a circle.
レシピ
- 値から作成する円グラフ
- スライスから作成する円グラフ
- スライスから作成するドーナツ
- ハッチ付き円グラフのスライス
- 円グラフの回転
- 円グラフのスライスラベル
- パーセントラベル付き円グラフ
- 異なるラベルを持つ円グラフ
値から作成する円グラフ
値から作成する円グラフ
円グラフは、いくつかの値から作成できます。
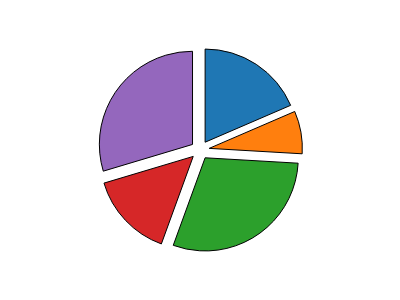
ScottPlot.Plot myPlot = new();
double[] values = { 5, 2, 8, 4, 8 };
var pie = myPlot.Add.Pie(values);
pie.ExplodeFraction = .1;
// 不要なプロットコンポーネントを非表示にする
myPlot.Axes.Frameless();
myPlot.HideGrid();
myPlot.SavePng("demo.png", 400, 300);
スライスから作成する円グラフ
スライスから作成する円グラフ
円グラフは、スライスのコレクションから作成できます。
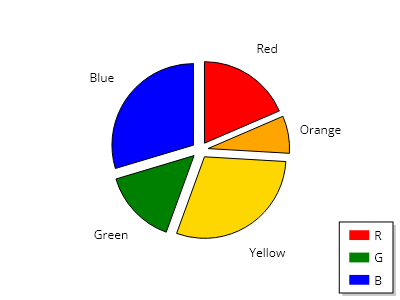
ScottPlot.Plot myPlot = new();
List<PieSlice> slices =
[
new PieSlice() { Value = 5, FillColor = Colors.Red, Label = "赤", LegendText = "R" },
new PieSlice() { Value = 2, FillColor = Colors.Orange, Label = "オレンジ" },
new PieSlice() { Value = 8, FillColor = Colors.Gold, Label = "黄" },
new PieSlice() { Value = 4, FillColor = Colors.Green, Label = "緑", LegendText = "G" },
new PieSlice() { Value = 8, FillColor = Colors.Blue, Label = "青", LegendText = "B" },
];
var pie = myPlot.Add.Pie(slices);
pie.ExplodeFraction = .1;
pie.SliceLabelDistance = 1.4;
myPlot.ShowLegend();
// 不要なプロットコンポーネントを非表示にする
myPlot.Axes.Frameless();
myPlot.HideGrid();
myPlot.SavePng("demo.png", 400, 300);
スライスから作成するドーナツ
スライスから作成するドーナツ
ドーナツチャートは、中央が空いた円グラフです。ドーナツチャートは、スライスのコレクションから作成できます。
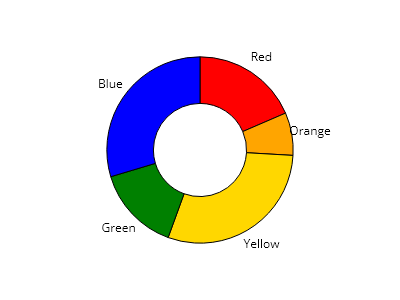
ScottPlot.Plot myPlot = new();
List<PieSlice> slices = new()
{
new PieSlice() { Value = 5, FillColor = Colors.Red, Label = "赤" },
new PieSlice() { Value = 2, FillColor = Colors.Orange, Label = "オレンジ" },
new PieSlice() { Value = 8, FillColor = Colors.Gold, Label = "黄色" },
new PieSlice() { Value = 4, FillColor = Colors.Green, Label = "緑" },
new PieSlice() { Value = 8, FillColor = Colors.Blue, Label = "青" },
};
var pie = myPlot.Add.Pie(slices);
pie.DonutFraction = .5;
myPlot.ShowLegend();
// 不要なプロットコンポーネントを非表示にする
myPlot.Axes.Frameless();
myPlot.HideGrid();
myPlot.SavePng("demo.png", 400, 300);
ハッチ付き円グラフのスライス
ハッチ付き円グラフのスライス
個々のスライスにはカスタムのハッチスタイルを指定できます
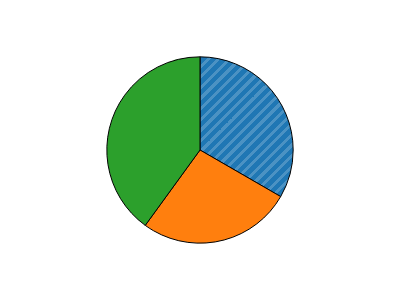
ScottPlot.Plot myPlot = new();
var pie = myPlot.Add.Pie([5, 4, 6]);
// 単一のスライスのハッチスタイルをカスタマイズする
pie.Slices[0].Fill.Hatch = new ScottPlot.Hatches.Striped();
pie.Slices[0].Fill.HatchColor = pie.Slices[0].Fill.Color.Lighten(.2);
// 不要なプロットコンポーネントを非表示にする
myPlot.Axes.Frameless();
myPlot.HideGrid();
myPlot.SavePng("demo.png", 400, 300);
円グラフの回転
円グラフの回転
円グラフは、最初のスライスがどこから始まるかを制御するために回転できます。
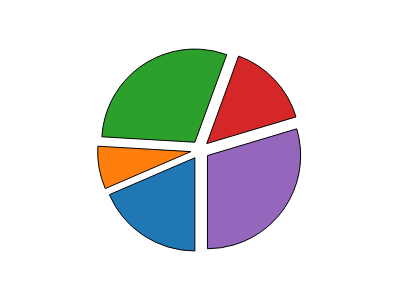
ScottPlot.Plot myPlot = new();
double[] values = { 5, 2, 8, 4, 8 };
var pie = myPlot.Add.Pie(values);
pie.ExplodeFraction = .1;
pie.Rotation = Angle.FromDegrees(90);
// 不要なプロットコンポーネントを非表示にする
myPlot.Axes.Frameless();
myPlot.HideGrid();
myPlot.SavePng("demo.png", 400, 300);
円グラフのスライスラベル
円グラフのスライスラベル
スライスラベルは、円グラフの中心からカスタマイズ可能な距離で、スライスの中央に表示できます。
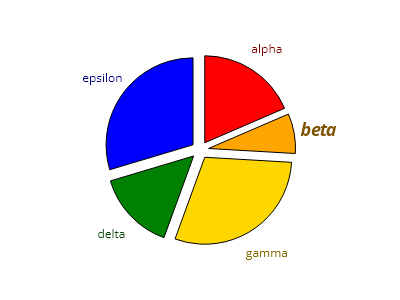
ScottPlot.Plot myPlot = new();
PieSlice slice1 = new() { Value = 5, FillColor = Colors.Red, Label = "アルファ" };
PieSlice slice2 = new() { Value = 2, FillColor = Colors.Orange, Label = "ベータ" };
PieSlice slice3 = new() { Value = 8, FillColor = Colors.Gold, Label = "ガンマ" };
PieSlice slice4 = new() { Value = 4, FillColor = Colors.Green, Label = "デルタ" };
PieSlice slice5 = new() { Value = 8, FillColor = Colors.Blue, Label = "イプシロン" };
List<PieSlice> slices = new() { slice1, slice2, slice3, slice4, slice5 };
// スライスラベルを表示するように円グラフを設定する
var pie = myPlot.Add.Pie(slices);
pie.ExplodeFraction = .1;
pie.SliceLabelDistance = 1.3;
// 各ラベルのテキストの色をスライスに合わせる
slices.ForEach(x => x.LabelFontColor = x.FillColor.Darken(.5));
// 個々のスライスごとにスタイルをカスタマイズできる
slice2.LabelStyle.FontSize = 18;
slice2.LabelStyle.Bold = true;
slice2.LabelStyle.Italic = true;
// 不要なプロットコンポーネントを非表示にする
myPlot.Axes.Frameless();
myPlot.HideGrid();
myPlot.SavePng("demo.png", 400, 300);
パーセントラベル付き円グラフ
パーセントラベル付き円グラフ
スライスラベルは、各スライスの中央に任意のテキスト(数値を含む)を表示するように調整できます。
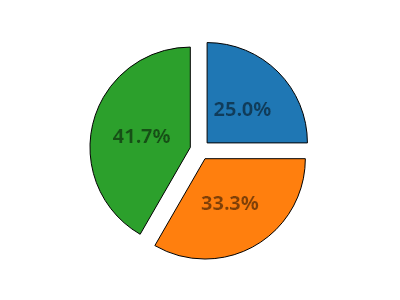
ScottPlot.Plot myPlot = new();
// 円グラフを作成する
double[] values = [6, 8, 10];
var pie = myPlot.Add.Pie(values);
pie.ExplodeFraction = .1;
pie.SliceLabelDistance = 0.5;
// 各スライスのパーセンテージを決定する
double total = pie.Slices.Select(x => x.Value).Sum();
double[] percentages = pie.Slices.Select(x => x.Value / total * 100).ToArray();
// 各スライスラベルをそのパーセンテージに設定する
for (int i = 0; i < pie.Slices.Count; i++)
{
pie.Slices[i].Label = $"{percentages[i]:0.0}%";
pie.Slices[i].LabelFontSize = 20;
pie.Slices[i].LabelBold = true;
pie.Slices[i].LabelFontColor = Colors.Black.WithAlpha(.5);
}
// 不要なプロットコンポーネントを非表示にする
myPlot.Axes.Frameless();
myPlot.HideGrid();
myPlot.SavePng("demo.png", 400, 300);
異なるラベルを持つ円グラフ
異なるラベルを持つ円グラフ
円グラフのスライスには、凡例に表示されるものとは独立したラベルを設定できます。
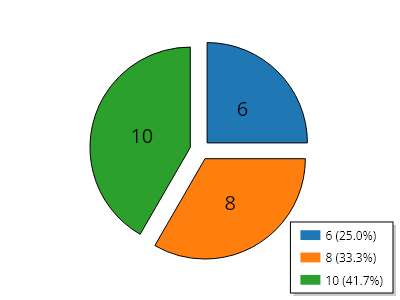
ScottPlot.Plot myPlot = new();
// 円グラフを作成する
double[] values = [6, 8, 10];
var pie = myPlot.Add.Pie(values);
pie.ExplodeFraction = 0.1;
pie.SliceLabelDistance = 0.5;
// スライスと凡例に異なるラベルを設定する
double total = pie.Slices.Select(x => x.Value).Sum();
for (int i = 0; i < pie.Slices.Count; i++)
{
pie.Slices[i].LabelFontSize = 20;
pie.Slices[i].Label = $"{pie.Slices[i].Value}";
pie.Slices[i].LegendText = $"{pie.Slices[i].Value} " +
$"({pie.Slices[i].Value / total:p1})";
}
// 不要なプロット要素を非表示にする
myPlot.Axes.Frameless();
myPlot.HideGrid();
myPlot.SavePng("demo.png", 400, 300);
極座標軸
Create a polar axis and add it to the plot to display data on a circular coordinate system.
レシピ
- 極座標軸
- 極座標軸の回転
- 時計回りの極座標軸
- 矢印付き極座標軸
- 極座標軸のスタイリング
- 極座標軸の背景
- Polar Axis のスポーク長
- 極座標軸のスポークラベル
- 極座標軸の目盛りラベル
- 極座標軸の線のカスタマイズ
- 極座標レーダープロット
- 極座標スポークラベルのパディング
- 線付きの極座標軸
極座標軸
極座標軸
極座標軸をプロットに追加し、そのヘルパーメソッドを使用して極座標を直交座標単位に変換することで、他のプロットタイプ(マーカー、線、散布図など)をその上に配置できます。
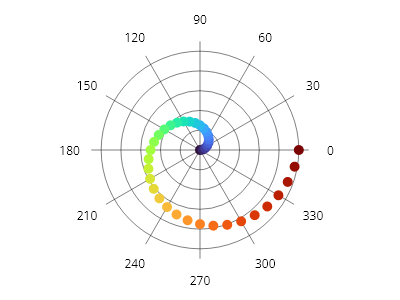
ScottPlot.Plot myPlot = new();
// 極座標軸をプロットに追加する
var polarAxis = myPlot.Add.PolarAxis();
IColormap colormap = new ScottPlot.Colormaps.Turbo();
foreach (double degrees in ScottPlot.Generate.Range(0, 360, 10))
{
// 極座標空間内の位置からX/Y座標を取得するために極座標軸を使用する
double radius = degrees / 360.0;
Coordinates pt = polarAxis.GetCoordinates(radius, degrees);
// 通常どおりX/Y座標を使用して、マーカーや他のプロットタイプを配置する
var marker = myPlot.Add.Marker(pt);
marker.Color = colormap.GetColor(radius);
}
myPlot.SavePng("demo.png", 400, 300);
極座標軸の回転
極座標軸の回転
極座標軸は、0 度のスポークの角度を定義するために回転できます。
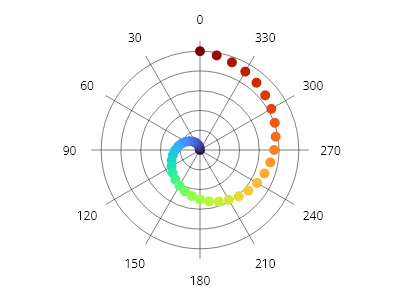
ScottPlot.Plot myPlot = new();
var polarAxis = myPlot.Add.PolarAxis();
polarAxis.Rotation = Angle.FromDegrees(90); // デフォルトの方向は反時計回りです
IColormap colormap = new ScottPlot.Colormaps.Turbo();
foreach (double degrees in ScottPlot.Generate.Range(0, 360, 10))
{
double radius = degrees / 360.0;
Coordinates pt = polarAxis.GetCoordinates(radius, degrees);
var marker = myPlot.Add.Marker(pt);
marker.Color = colormap.GetColor(radius);
}
myPlot.SavePng("demo.png", 400, 300);
時計回りの極座標軸
時計回りの極座標軸
時計回りの極座標プロットは、空間的な向きを表すためによく使用されます。
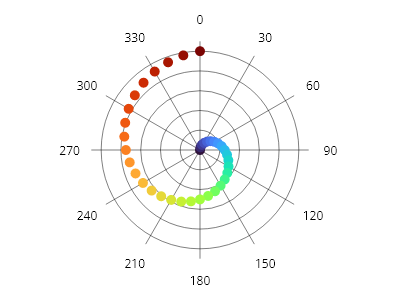
ScottPlot.Plot myPlot = new();
var polarAxis = myPlot.Add.PolarAxis();
polarAxis.Clockwise = true;
polarAxis.Rotation = Angle.FromDegrees(-90); // 方向は反時計回りになります
IColormap colormap = new ScottPlot.Colormaps.Turbo();
foreach (double degrees in ScottPlot.Generate.Range(0, 360, 10))
{
double fraction = degrees / 360.0;
Coordinates pt = polarAxis.GetCoordinates(fraction, degrees);
var marker = myPlot.Add.Marker(pt);
marker.Color = colormap.GetColor(fraction);
}
myPlot.SavePng("demo.png", 400, 300);
矢印付き極座標軸
矢印付き極座標軸
矢印は、基点を中心に置き、先端で極座標空間内の点を示すために、極座標系上に配置できます。Phaser プロット型は、この戦略を使用して、同様のスタイルが適用された矢印のコレクションを表示します。
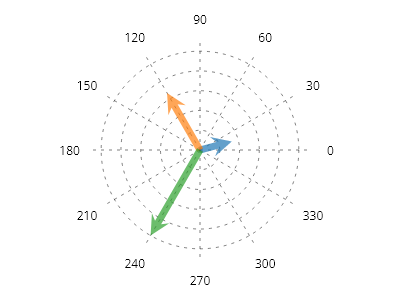
ScottPlot.Plot myPlot = new();
PolarCoordinates[] points = [
new(10, Angle.FromDegrees(15)),
new(20, Angle.FromDegrees(120)),
new(30, Angle.FromDegrees(240)),
];
var polarAxis = myPlot.Add.PolarAxis(radius: 30);
polarAxis.Circles.ForEach(x => x.LinePattern = LinePattern.Dotted);
polarAxis.Spokes.ForEach(x => x.LinePattern = LinePattern.Dotted);
IPalette palette = new ScottPlot.Palettes.Category10();
Coordinates center = polarAxis.GetCoordinates(0, 0);
for (int i = 0; i < points.Length; i++)
{
Coordinates tip = polarAxis.GetCoordinates(points[i]);
var arrow = myPlot.Add.Arrow(center, tip);
arrow.ArrowLineWidth = 0;
arrow.ArrowFillColor = palette.GetColor(i).WithAlpha(.7);
}
myPlot.SavePng("demo.png", 400, 300);
極座標軸のスタイリング
極座標軸のスタイリング
極座標軸の線は幅広くスタイル設定できます。極座標軸には、放射状のスポーク(原点から最大半径まで伸びる直線)と円形の軸線(原点を中心とする同心円)があります。
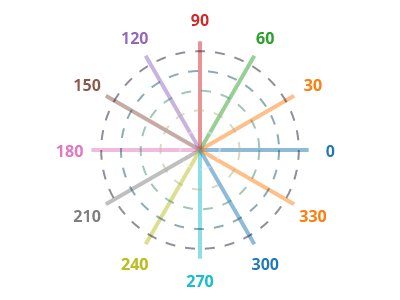
ScottPlot.Plot myPlot = new();
var polarAxis = myPlot.Add.PolarAxis();
// スポーク(回転を示すために中心から伸びる直線)をスタイル設定する
var radialPalette = new ScottPlot.Palettes.Category10();
for (int i = 0; i < polarAxis.Spokes.Count; i++)
{
polarAxis.Spokes[i].LineColor = radialPalette.GetColor(i).WithAlpha(.5);
polarAxis.Spokes[i].LineWidth = 4;
polarAxis.Spokes[i].LabelStyle.ForeColor = radialPalette.GetColor(i);
polarAxis.Spokes[i].LabelStyle.FontSize = 16;
polarAxis.Spokes[i].LabelStyle.Bold = true;
}
// 円(半径位置を示す同心円)をスタイル設定する
var circularColormap = new ScottPlot.Colormaps.Rain();
for (int i = 0; i < polarAxis.Circles.Count; i++)
{
double fraction = (double)i / (polarAxis.Circles.Count - 1);
polarAxis.Circles[i].LineColor = circularColormap.GetColor(fraction).WithAlpha(.5);
polarAxis.Circles[i].LineWidth = 2;
polarAxis.Circles[i].LinePattern = LinePattern.Dashed;
}
myPlot.SavePng("demo.png", 400, 300);
極座標軸の背景
極座標軸の背景
極座標軸の背景スタイルはカスタマイズできます
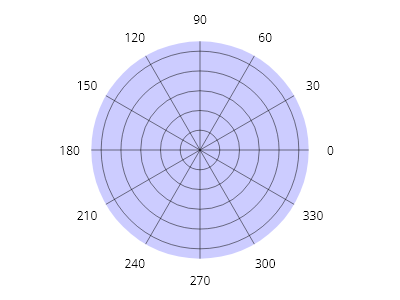
ScottPlot.Plot myPlot = new();
var polarAxis = myPlot.Add.PolarAxis();
polarAxis.FillColor = Colors.Blue.WithAlpha(.2);
myPlot.SavePng("demo.png", 400, 300);
Polar Axis のスポーク長
Polar Axis のスポーク長
スポークの長さはカスタマイズできます。スポーク長は、極軸の半径に対する割合として表されます。
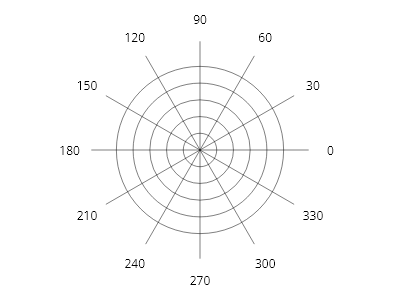
ScottPlot.Plot myPlot = new();
myPlot.Add.PolarAxis(spokeLength: 1.3);
myPlot.SavePng("demo.png", 400, 300);
極座標軸のスポークラベル
極座標軸のスポークラベル
極座標軸のスポークには、個別にラベルを付けることができます。
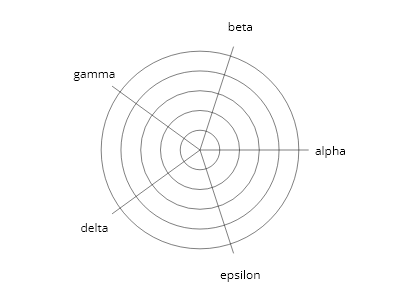
ScottPlot.Plot myPlot = new();
var polarAxis = myPlot.Add.PolarAxis();
string[] labels = { "alpha", "beta", "gamma", "delta", "epsilon" };
polarAxis.SetSpokes(labels, 1.1);
myPlot.SavePng("demo.png", 400, 300);
極座標軸の目盛りラベル
極座標軸の目盛りラベル
極座標軸の目盛りは円で示され、それぞれ個別にラベルを付けることができます。
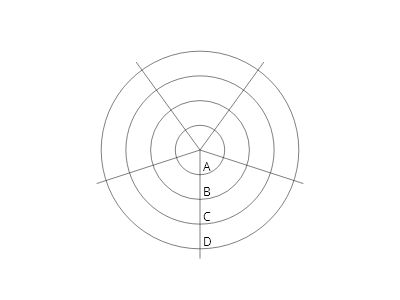
ScottPlot.Plot myPlot = new();
var polarAxis = myPlot.Add.PolarAxis();
polarAxis.Rotation = Angle.FromDegrees(-90);
double[] ticksPositions = { 5, 10, 15, 20 };
string[] tickLabels = { "A", "B", "C", "D" };
polarAxis.SetCircles(ticksPositions, tickLabels);
polarAxis.SetSpokes(count: 5, length: 22, degreeLabels: false);
myPlot.SavePng("demo.png", 400, 300);
極座標軸の線のカスタマイズ
極座標軸の線のカスタマイズ
スポークの角度と長さ、および円の位置は手動で定義できます。各スポークと円は個別にスタイル設定することもできます。
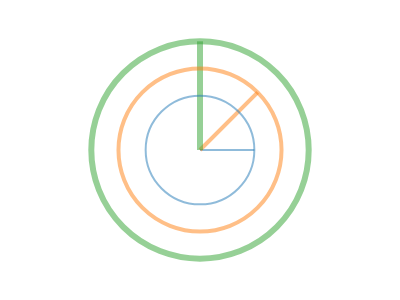
ScottPlot.Plot myPlot = new();
var polarAxis = myPlot.Add.PolarAxis();
// スポークの角度と長さを定義する
polarAxis.Spokes.Clear();
polarAxis.Spokes.Add(new(Angle.FromDegrees(0), 0.5));
polarAxis.Spokes.Add(new(Angle.FromDegrees(45), 0.75));
polarAxis.Spokes.Add(new(Angle.FromDegrees(90), 1.0));
// 円の半径を定義する
polarAxis.Circles.Clear();
polarAxis.Circles.Add(new(0.5));
polarAxis.Circles.Add(new(0.75));
polarAxis.Circles.Add(new(1.0));
// 個別のスポークと円のスタイルを設定する
ScottPlot.Palettes.Category10 pal = new();
for (int i = 0; i < 3; i++)
{
polarAxis.Circles[i].LineColor = pal.GetColor(i).WithAlpha(.5);
polarAxis.Spokes[i].LineColor = pal.GetColor(i).WithAlpha(.5);
polarAxis.Circles[i].LineWidth = 2 + i * 2;
polarAxis.Spokes[i].LineWidth = 2 + i * 2;
}
myPlot.SavePng("demo.png", 400, 300);
極座標レーダープロット
極座標レーダープロット
極座標軸とポリゴンを組み合わせることは、レーダープロットを作成するための代替手法です。
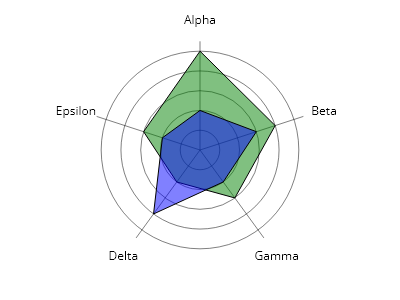
ScottPlot.Plot myPlot = new();
var polarAxis = myPlot.Add.PolarAxis();
polarAxis.Clockwise = true;
polarAxis.Rotation = Angle.FromDegrees(-90);
// ラベル付きスポークを追加する
string[] labels = { "Alpha", "Beta", "Gamma", "Delta", "Epsilon" };
polarAxis.SetSpokes(labels, length: 5.5);
// 定義済みの目盛りを追加する
double[] ticks = { 1, 2, 3, 4, 5 };
polarAxis.SetCircles(ticks);
// レーダー値を座標に変換する
double[] values1 = { 5, 4, 3, 2, 3 };
double[] values2 = { 2, 3, 2, 4, 2 };
Coordinates[] cs1 = polarAxis.GetCoordinates(values1);
Coordinates[] cs2 = polarAxis.GetCoordinates(values2);
// 各データセットのポリゴンを追加する
var poly1 = myPlot.Add.Polygon(cs1);
poly1.FillColor = Colors.Green.WithAlpha(.5);
poly1.LineColor = Colors.Black;
var poly2 = myPlot.Add.Polygon(cs2);
poly2.FillColor = Colors.Blue.WithAlpha(.5);
poly2.LineColor = Colors.Black;
myPlot.SavePng("demo.png", 400, 300);
極座標スポークラベルのパディング
極座標スポークラベルのパディング
極座標スポーク上のラベルのパディングを変更します。
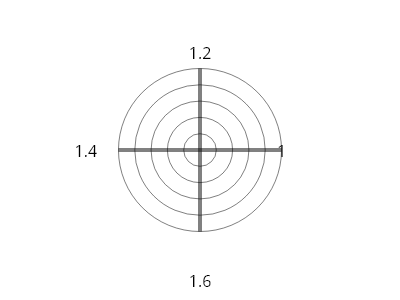
ScottPlot.Plot myPlot = new();
var polarAxis = myPlot.Add.PolarAxis();
polarAxis.SetSpokes(4, 1);
for (int i = 0; i < polarAxis.Spokes.Count; i++)
{
polarAxis.Spokes[i].LineWidth = 4;
polarAxis.Spokes[i].LabelStyle.FontSize = 16;
polarAxis.Spokes[i].LabelPaddingFraction = 0.2 * i;
polarAxis.Spokes[i].LabelText = $"{polarAxis.Spokes[i].LabelLength}";
}
myPlot.SavePng("demo.png", 400, 300);
線付きの極座標軸
線付きの極座標軸
これは、点ではなく線を使用した極座標軸の例です
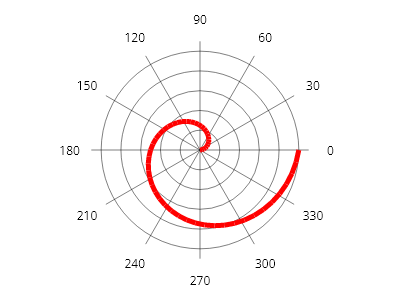
ScottPlot.Plot myPlot = new();
// プロットに極座標軸を追加する
var polarAxis = myPlot.Add.PolarAxis(radius: 100);
IColormap colormap = new ScottPlot.Colormaps.Turbo();
Coordinates? previousPt = null;
foreach (double fraction in ScottPlot.Generate.Range(0, 1, 0.02))
{
// 極座標軸を使用して、極空間内の位置から X/Y 座標を取得する
double radius = 100 *fraction;
double degrees = 360* fraction;
Coordinates pt = polarAxis.GetCoordinates(radius, degrees);
if (previousPt != null)
{
ScottPlot.Plottables.LinePlot lp = myPlot.Add.Line(previousPt.Value.X, previousPt.Value.Y, pt.X, pt.Y);
lp.LineWidth = 5;
lp.Color = Colors.Red;
previousPt = pt;
}
else
{
previousPt = pt;
}
}
myPlot.SavePng("demo.png", 400, 300);
母集団プロット
Population plots display collections of individual values.
レシピ
- Population クイックスタート
- 母集団箱ひげ図
- 母集団ボックス値
- Population バーのスタイル設定
- Population ボックスのスタイリング
- 母集団マーカーのスタイリング
- 母集団の配置
- 母集団グループ
Population クイックスタート
Population クイックスタート
Population は、値のコレクションから作成し、必要に応じてスタイルを設定して、プロット上の任意の場所に配置できます。
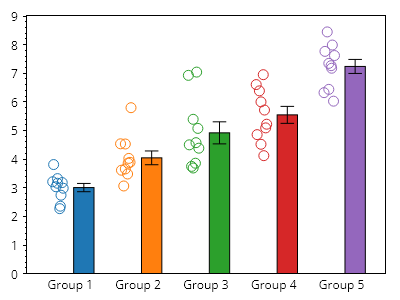
ScottPlot.Plot myPlot = new();
for (int i = 0; i < 5; i++)
{
double[] values = Generate.RandomNormal(10, mean: 3 + i);
myPlot.Add.Population(values, x: i);
}
// デフォルトでプロットの下端がゼロにスナップするようにする
myPlot.Axes.Margins(bottom: 0);
// デフォルトの数値目盛りをカスタムのものに置き換える
double[] tickPositions = Generate.Consecutive(5);
string[] tickLabels = Enumerable.Range(1, 5).Select(x => $"グループ {x}").ToArray();
myPlot.Axes.Bottom.SetTicks(tickPositions, tickLabels);
// プロットの外観を調整する
myPlot.Axes.Bottom.MajorTickStyle.Length = 0;
myPlot.Axes.Margins(bottom: 0);
myPlot.HideGrid();
myPlot.SavePng("demo.png", 400, 300);
母集団箱ひげ図
母集団箱ひげ図
母集団統計は箱ひげ図を使用して表示できます。
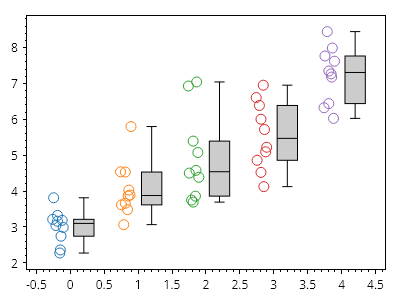
ScottPlot.Plot myPlot = new();
for (int i = 0; i < 5; i++)
{
double[] values = Generate.RandomNormal(10, mean: 3 + i);
var pop = myPlot.Add.Population(values, x: i);
// バー記号の表示を無効にする
pop.Bar.IsVisible = false;
// ボックス記号の表示を有効にする
pop.Box.IsVisible = true;
}
// プロットの外観を調整する
myPlot.HideGrid();
myPlot.SavePng("demo.png", 400, 300);
母集団ボックス値
母集団ボックス値
ボックスの中央線、本体、ひげによって表示される値は、静的関数をボックス値設定プロパティに割り当てることで設定できます。
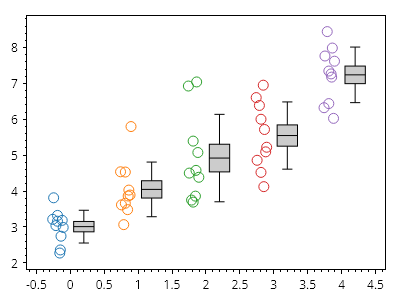
ScottPlot.Plot myPlot = new();
for (int i = 0; i < 5; i++)
{
double[] values = Generate.RandomNormal(10, mean: 3 + i);
var pop = myPlot.Add.Population(values, x: i);
pop.Bar.IsVisible = false;
pop.Box.IsVisible = true;
pop.BoxValueConfig = PopulationSymbol.BoxValueConfigurator_MeanStdErrStDev;
}
// プロットの外観を調整する
myPlot.HideGrid();
myPlot.SavePng("demo.png", 400, 300);
Population バーのスタイル設定
Population バーのスタイル設定
population プロットのバーシンボルは、幅広くスタイル設定できます。
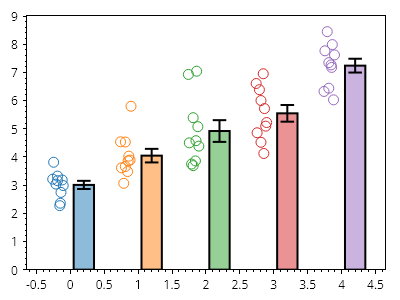
ScottPlot.Plot myPlot = new();
for (int i = 0; i < 5; i++)
{
double[] values = Generate.RandomNormal(10, mean: 3 + i);
var pop = myPlot.Add.Population(values, x: i);
pop.Bar.FillColor = pop.Marker.MarkerLineColor.WithAlpha(.5);
pop.Bar.LineWidth = 2;
pop.Bar.ErrorNegative = false;
}
// プロットの外観を調整する
myPlot.Axes.Margins(bottom: 0);
myPlot.HideGrid();
myPlot.SavePng("demo.png", 400, 300);
Population ボックスのスタイリング
Population ボックスのスタイリング
Population プロットのボックス記号は、広範にスタイル設定できます。
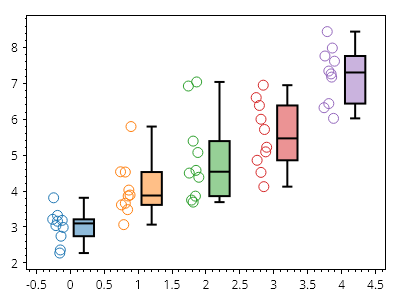
ScottPlot.Plot myPlot = new();
for (int i = 0; i < 5; i++)
{
double[] values = Generate.RandomNormal(10, mean: 3 + i);
var pop = myPlot.Add.Population(values, x: i);
pop.Bar.IsVisible = false;
pop.Box.IsVisible = true;
pop.Box.LineWidth = 2;
pop.Box.FillColor = pop.Marker.MarkerLineColor.WithAlpha(.5);
}
// プロットの外観を調整する
myPlot.HideGrid();
myPlot.SavePng("demo.png", 400, 300);
母集団マーカーのスタイリング
母集団マーカーのスタイリング
母集団プロットのデータマーカーは、幅広くスタイル設定できます。
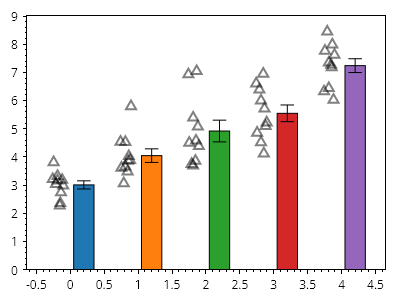
ScottPlot.Plot myPlot = new();
for (int i = 0; i < 5; i++)
{
double[] values = Generate.RandomNormal(10, mean: 3 + i);
var pop = myPlot.Add.Population(values, x: i);
pop.Marker.LineWidth = 2;
pop.Marker.Color = Colors.Black.WithAlpha(.5);
pop.Marker.Shape = MarkerShape.OpenTriangleUp;
}
// プロットの外観を調整する
myPlot.Axes.Margins(bottom: 0);
myPlot.HideGrid();
myPlot.SavePng("demo.png", 400, 300);
母集団の配置
母集団の配置
ユーザーは、バーまたはボックスに対してデータを描画する位置をカスタマイズできます。すべてを中央揃えにすると、データ点がバーまたはボックスの上に描画される効果を実現できます。
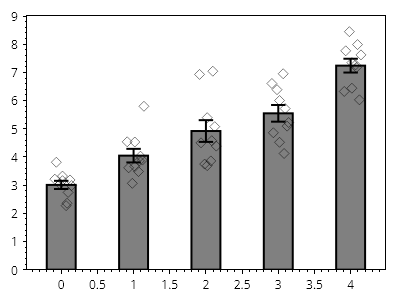
ScottPlot.Plot myPlot = new();
for (int i = 0; i < 5; i++)
{
double[] values = Generate.RandomNormal(10, mean: 3 + i);
var pop = myPlot.Add.Population(values, x: i);
pop.MarkerAlignment = HorizontalAlignment.Center;
pop.BarAlignment = HorizontalAlignment.Center;
pop.Marker.Shape = MarkerShape.OpenDiamond;
pop.Marker.Color = Colors.Black.WithAlpha(.5);
pop.Bar.FillColor = Colors.Gray;
pop.Bar.LineWidth = 2;
pop.Width = 0.5;
}
// プロットの外観を調整する
myPlot.Axes.Margins(bottom: 0);
myPlot.HideGrid();
myPlot.SavePng("demo.png", 400, 300);
母集団グループ
母集団グループ
母集団のグループは、位置、色、軸ラベル、凡例項目をカスタマイズすることで実現できます。
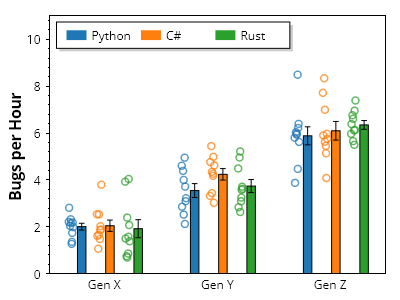
ScottPlot.Plot myPlot = new();
// グループを定義する
string[] groupNames = { "Gen X", "Gen Y", "Gen Z" };
string[] categoryNames = { "Python", "C#", "Rust" };
Color[] categoryColors = { Colors.C0, Colors.C1, Colors.C2 };
// ランダムデータをプロットに追加する
for (int groupIndex = 0; groupIndex < groupNames.Length; groupIndex++)
{
for (int categoryIndex = 0; categoryIndex < categoryNames.Length; categoryIndex++)
{
double[] values = Generate.RandomNormal(10, mean: 2 + groupIndex *2);
double x = groupIndex* (categoryNames.Length + 1) + categoryIndex;
var pop = myPlot.Add.Population(values, x);
pop.Marker.MarkerLineColor = categoryColors[categoryIndex].WithAlpha(.75);
pop.Marker.Size = 7;
pop.Marker.LineWidth = 1.5f;
pop.Bar.FillColor = categoryColors[categoryIndex];
}
}
// グループ名を水平方向の目盛ラベルに適用する
double tickDelta = categoryNames.Length + 1;
double[] tickPositions = Enumerable.Range(0, groupNames.Length)
.Select(x => x * tickDelta + tickDelta / 2 - 1)
.ToArray();
myPlot.Axes.Bottom.SetTicks(tickPositions, groupNames);
myPlot.Axes.Bottom.MajorTickStyle.Length = 0;
// 凡例にカテゴリの色を表示する
for (int i = 0; i < categoryNames.Length; i++)
{
LegendItem item = new()
{
FillColor = categoryColors[i],
LabelText = categoryNames[i]
};
myPlot.Legend.ManualItems.Add(item);
}
myPlot.Legend.Orientation = Orientation.Horizontal;
myPlot.Legend.Alignment = Alignment.UpperLeft;
// プロットの外観を調整する
myPlot.Axes.Margins(bottom: 0, top: 0.3);
myPlot.YLabel("1時間あたりのバグ数");
myPlot.HideGrid();
myPlot.SavePng("demo.png", 400, 300);
レーダープロット
Radar charts (also called a spider charts or star charts) represent multi-axis data as a 2D shape on axes arranged circularly around a center point.
レシピ
- レーダープロットのクイックスタート
- 複数系列のレーダープロット
- レーダー凡例
- レーダー系列のカスタマイズ
- レーダーのスポークラベル
- Radar の放射状目盛ラベル
- 直線を使用したレーダー
- データの上に軸を表示
レーダープロットのクイックスタート
レーダープロットのクイックスタート
レーダーチャートは、値の単一の配列から作成できます。
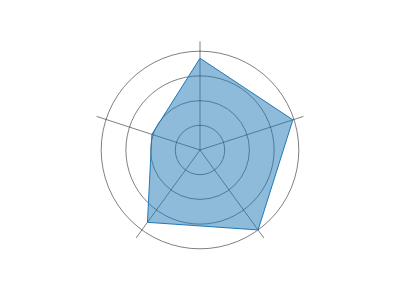
ScottPlot.Plot myPlot = new();
double[] values = { 78, 83, 84, 76, 43 };
myPlot.Add.Radar(values);
myPlot.SavePng("demo.png", 400, 300);
複数系列のレーダープロット
複数系列のレーダープロット
単一のレーダーチャートで、2D 配列を使用して複数系列の値を表示できます
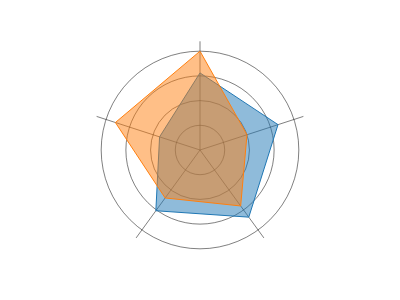
ScottPlot.Plot myPlot = new();
double[,] values = {
{ 78, 83, 84, 76, 43 },
{ 100, 50, 70, 60, 90 }
};
myPlot.Add.Radar(values);
myPlot.SavePng("demo.png", 400, 300);
レーダー凡例
レーダー凡例
レーダー値のコレクション(レーダー系列)にはラベルを付けることができ、凡例に表示されます
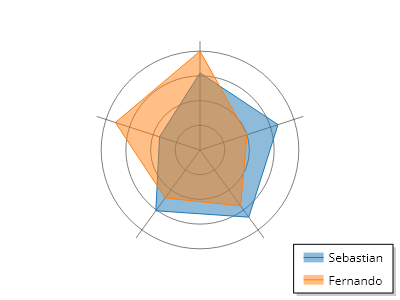
ScottPlot.Plot myPlot = new();
double[,] values = {
{ 78, 83, 84, 76, 43 },
{ 100, 50, 70, 60, 90 }
};
var radar = myPlot.Add.Radar(values);
radar.Series[0].LegendText = "Sebastian";
radar.Series[1].LegendText = "Fernando";
myPlot.SavePng("demo.png", 400, 300);
レーダー系列のカスタマイズ
レーダー系列のカスタマイズ
レーダープロットには RadarSeries オブジェクトのコレクションがあり、それぞれが値のセットと、それをレーダープロット上の形状として表示するために使用されるスタイル情報を記述します。ユーザーはレーダー系列オブジェクトのプロパティを変更することで、各形状を高度にカスタマイズできます。
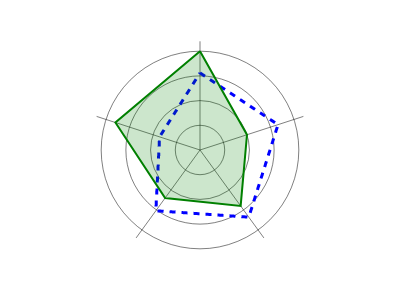
ScottPlot.Plot myPlot = new();
double[,] values = {
{ 78, 83, 84, 76, 43 },
{ 100, 50, 70, 60, 90 }
};
var radar = myPlot.Add.Radar(values);
radar.Series[0].FillColor = Colors.Transparent;
radar.Series[0].LineColor = Colors.Blue;
radar.Series[0].LineWidth = 3;
radar.Series[0].LinePattern = LinePattern.DenselyDashed;
radar.Series[1].FillColor = Colors.Green.WithAlpha(.2);
radar.Series[1].LineColor = Colors.Green;
radar.Series[1].LineWidth = 2;
myPlot.SavePng("demo.png", 400, 300);
レーダーのスポークラベル
レーダーのスポークラベル
スポークにラベルを割り当てて、レーダープロットの円周上の値にラベルを付けることができます
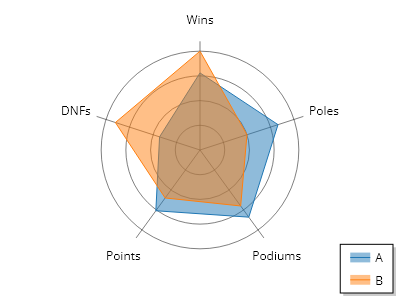
ScottPlot.Plot myPlot = new();
double[,] values = {
{ 78, 83, 84, 76, 43 },
{ 100, 50, 70, 60, 90 }
};
var radar = myPlot.Add.Radar(values);
radar.Series[0].LegendText = "A";
radar.Series[1].LegendText = "B";
string[] spokeLabels = { "勝利数", "ポール数", "表彰台数", "ポイント", "リタイア数" };
radar.PolarAxis.SetSpokes(spokeLabels, length: 110);
myPlot.SavePng("demo.png", 400, 300);
Radar の放射状目盛ラベル
Radar の放射状目盛ラベル
Radar の放射状目盛の位置とラベルはユーザーが定義できます
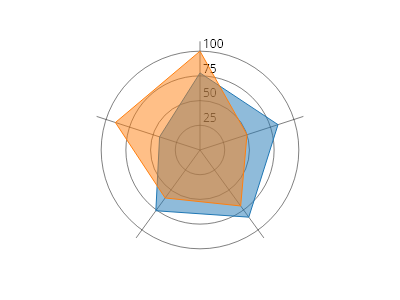
ScottPlot.Plot myPlot = new();
double[,] values = {
{ 78, 83, 84, 76, 43 },
{ 100, 50, 70, 60, 90 }
};
var radar = myPlot.Add.Radar(values);
double[] tickPositions = { 25, 50, 75, 100 };
string[] tickLabels = tickPositions.Select(x => x.ToString()).ToArray();
radar.PolarAxis.SetCircles(tickPositions, tickLabels);
myPlot.SavePng("demo.png", 400, 300);
直線を使用したレーダー
直線を使用したレーダー
放射状の目盛りは、円の代わりに直線を使用してレンダリングできます
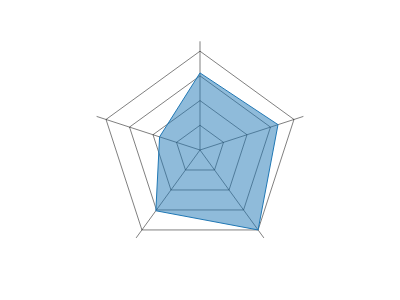
ScottPlot.Plot myPlot = new();
double[] values = { 78, 83, 100, 76, 43 };
var radar = myPlot.Add.Radar(values);
radar.PolarAxis.StraightLines = true;
myPlot.SavePng("demo.png", 400, 300);
データの上に軸を表示
データの上に軸を表示
レーダーチャートは、軸がデータの上にレンダリングされるようにカスタマイズできます
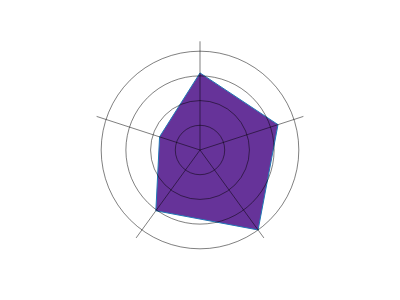
ScottPlot.Plot myPlot = new();
double[] values = { 78, 83, 100, 76, 43 };
var radar = myPlot.Add.Radar(values);
// 図形を不透明にする
radar.Series[0].FillColor = Colors.RebeccaPurple;
// データの上に軸をレンダリングする
radar.IsAxisAboveData = true;
myPlot.SavePng("demo.png", 400, 300);
ラジアルゲージ
A radial gauge chart displays scalar data as circular gauges.
レシピ
- 値から作成するラジアルゲージ
- ゲージの色
- 負の値
- シーケンシャルゲージモード
- 逆順
- 単一ゲージモード
- ゲージの方向
- ゲージサイズ
- ゲージの開始角度
- ゲージの角度範囲
- レベルの表示
- ゲージラベルの位置
- ゲージラベルのフォント割合
- ゲージラベルの色
- 凡例内のゲージラベル
- 背景ゲージの淡色表示
- 背景ゲージの正規化
値から作成するラジアルゲージ
値から作成するラジアルゲージ
ラジアルゲージチャートは、いくつかの値から作成できます。
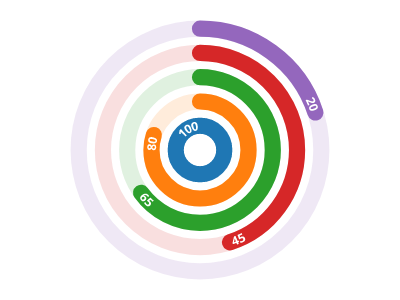
ScottPlot.Plot myPlot = new();
double[] values = { 100, 80, 65, 45, 20 };
myPlot.Add.RadialGaugePlot(values);
myPlot.SavePng("demo.png", 400, 300);
ゲージの色
ゲージの色
ゲージの色は、デフォルトのパレットを変更することでカスタマイズできます。
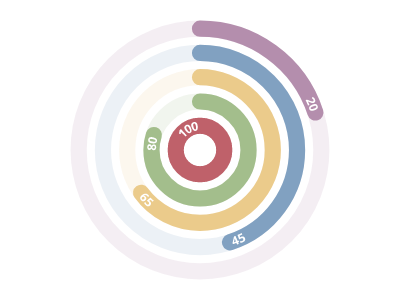
ScottPlot.Plot myPlot = new();
myPlot.Add.Palette = new ScottPlot.Palettes.Nord();
double[] values = { 100, 80, 65, 45, 20 };
myPlot.Add.RadialGaugePlot(values);
myPlot.SavePng("demo.png", 400, 300);
負の値
負の値
ラジアルゲージプロットは、正の値と負の値をサポートします。
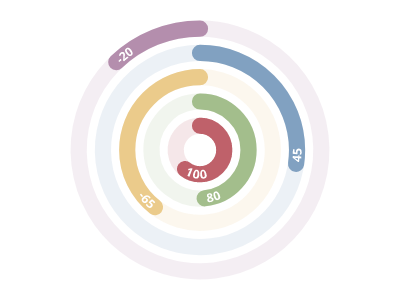
ScottPlot.Plot myPlot = new();
myPlot.Add.Palette = new ScottPlot.Palettes.Nord();
double[] values = { 100, 80, -65, 45, -20 };
myPlot.Add.RadialGaugePlot(values);
myPlot.SavePng("demo.png", 400, 300);
シーケンシャルゲージモード
シーケンシャルゲージモード
シーケンシャルゲージモードは、各ゲージの基点が前のゲージの先端から始まることを示します。
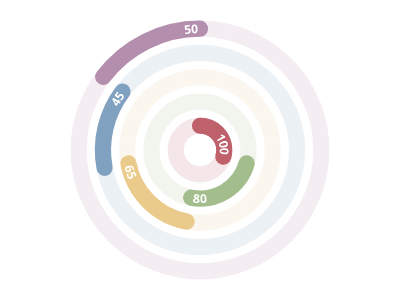
ScottPlot.Plot myPlot = new();
myPlot.Add.Palette = new ScottPlot.Palettes.Nord();
double[] values = { 100, 80, 65, 45, 50 };
var radialGaugePlot = myPlot.Add.RadialGaugePlot(values);
radialGaugePlot.GaugeMode = ScottPlot.RadialGaugeMode.Sequential;
myPlot.SavePng("demo.png", 400, 300);
逆順
逆順
ゲージはデフォルトで中心から外側に向かって表示されますが、順序はカスタマイズできます。
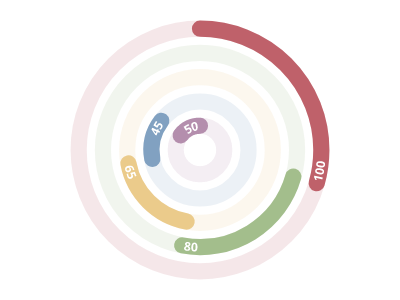
ScottPlot.Plot myPlot = new();
myPlot.Add.Palette = new ScottPlot.Palettes.Nord();
double[] values = { 100, 80, 65, 45, 50 };
var radialGaugePlot = myPlot.Add.RadialGaugePlot(values);
radialGaugePlot.GaugeMode = ScottPlot.RadialGaugeMode.Sequential;
radialGaugePlot.OrderInsideOut = false;
myPlot.SavePng("demo.png", 400, 300);
単一ゲージモード
単一ゲージモード
SingleGauge モードは、すべてのゲージを 1 つのゲージとして重ねて描画します。これは、多数の個別の小さなゲージで構成される進捗ゲージを表示する場合に便利です。
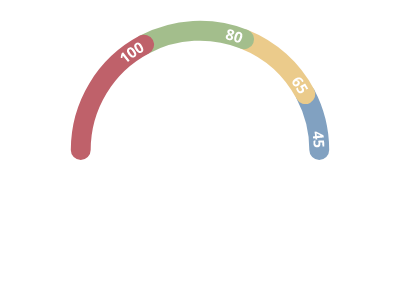
ScottPlot.Plot myPlot = new();
myPlot.Add.Palette = new ScottPlot.Palettes.Nord();
double[] values = { 100, 80, 65, 45 };
var radialGaugePlot = myPlot.Add.RadialGaugePlot(values);
radialGaugePlot.GaugeMode = ScottPlot.RadialGaugeMode.SingleGauge;
radialGaugePlot.MaximumAngle = 180;
radialGaugePlot.StartingAngle = 180;
myPlot.SavePng("demo.png", 400, 300);
ゲージの方向
ゲージの方向
ゲージの方向はカスタマイズできます。デフォルトでは時計回りが使用されます。
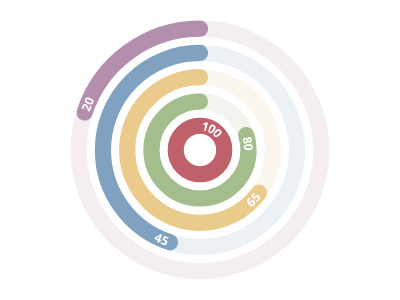
ScottPlot.Plot myPlot = new();
myPlot.Add.Palette = new ScottPlot.Palettes.Nord();
double[] values = { 100, 80, 65, 45, 20 };
var radialGaugePlot = myPlot.Add.RadialGaugePlot(values);
radialGaugePlot.Clockwise = false;
myPlot.SavePng("demo.png", 400, 300);
ゲージサイズ
ゲージサイズ
ゲージ間の空白は、ゲージの幅に対する割合として調整できます。
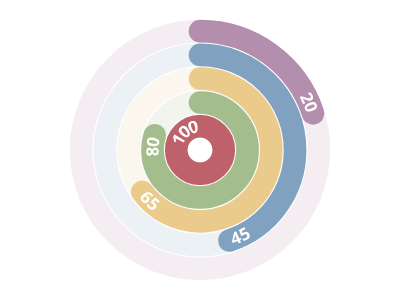
ScottPlot.Plot myPlot = new();
myPlot.Add.Palette = new ScottPlot.Palettes.Nord();
double[] values = { 100, 80, 65, 45, 20 };
var radialGaugePlot = myPlot.Add.RadialGaugePlot(values);
radialGaugePlot.SpaceFraction = .05;
myPlot.SavePng("demo.png", 400, 300);
ゲージの開始角度
ゲージの開始角度
ゲージの開始角度はカスタマイズできます。北は 270(デフォルト値)、東は 0、南は 90、西は 180、などです。
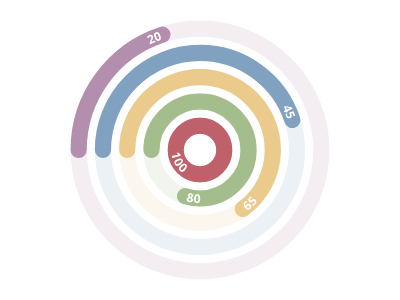
ScottPlot.Plot myPlot = new();
myPlot.Add.Palette = new ScottPlot.Palettes.Nord();
double[] values = { 100, 80, 65, 45, 20 };
var radialGaugePlot = myPlot.Add.RadialGaugePlot(values);
radialGaugePlot.StartingAngle = 180;
myPlot.SavePng("demo.png", 400, 300);
ゲージの角度範囲
ゲージの角度範囲
デフォルトでは、ゲージは完全な円(360度)ですが、ゲージのサイズをカスタマイズすることで、より小さなゲージを作成できます。
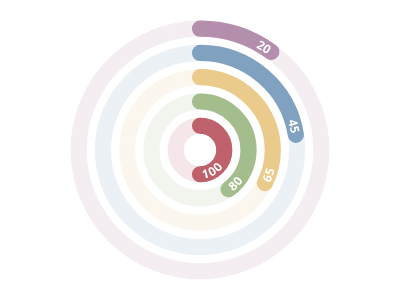
ScottPlot.Plot myPlot = new();
myPlot.Add.Palette = new ScottPlot.Palettes.Nord();
double[] values = { 100, 80, 65, 45, 20 };
var radialGaugePlot = myPlot.Add.RadialGaugePlot(values);
radialGaugePlot.MaximumAngle = 180;
myPlot.SavePng("demo.png", 400, 300);
レベルの表示
レベルの表示
各ゲージの値はデフォルトでテキストとして表示されますが、この動作は上書きできます。これは、凡例に表示される labels フィールドとは異なることに注意してください。

ScottPlot.Plot myPlot = new();
myPlot.Add.Palette = new ScottPlot.Palettes.Nord();
double[] values = { 100, 80, 65, 45, 20 };
var radialGaugePlot = myPlot.Add.RadialGaugePlot(values);
radialGaugePlot.ShowLevels = false;
myPlot.SavePng("demo.png", 400, 300);
ゲージラベルの位置
ゲージラベルの位置
ゲージレベルのテキストはデフォルトで各ゲージの先端に配置されますが、この位置はユーザーが調整できます。
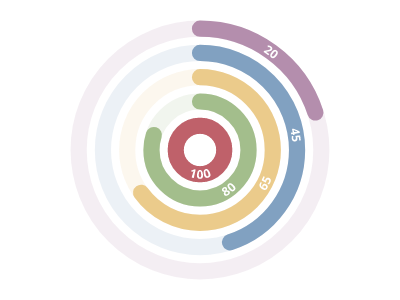
ScottPlot.Plot myPlot = new();
myPlot.Add.Palette = new ScottPlot.Palettes.Nord();
double[] values = { 100, 80, 65, 45, 20 };
var radialGaugePlot = myPlot.Add.RadialGaugePlot(values);
radialGaugePlot.LabelPositionFraction = 0.5;
myPlot.SavePng("demo.png", 400, 300);
ゲージラベルのフォント割合
ゲージラベルのフォント割合
ゲージ幅に対する割合としてのゲージレベルテキストのサイズ。
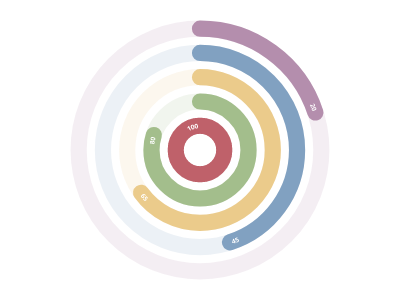
ScottPlot.Plot myPlot = new();
myPlot.Add.Palette = new ScottPlot.Palettes.Nord();
double[] values = { 100, 80, 65, 45, 20 };
var radialGaugePlot = myPlot.Add.RadialGaugePlot(values);
radialGaugePlot.FontSizeFraction = .4;
myPlot.SavePng("demo.png", 400, 300);
ゲージラベルの色
ゲージラベルの色
レベルテキストのフォントはカスタマイズできます。
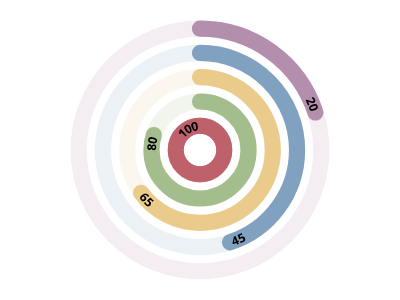
ScottPlot.Plot myPlot = new();
myPlot.Add.Palette = new ScottPlot.Palettes.Nord();
double[] values = { 100, 80, 65, 45, 20 };
var radialGaugePlot = myPlot.Add.RadialGaugePlot(values);
radialGaugePlot.Font.Color = Colors.Black;
myPlot.SavePng("demo.png", 400, 300);
凡例内のゲージラベル
凡例内のゲージラベル
ラジアルゲージのラベルが割り当てられている場合、それらは凡例に表示されます。
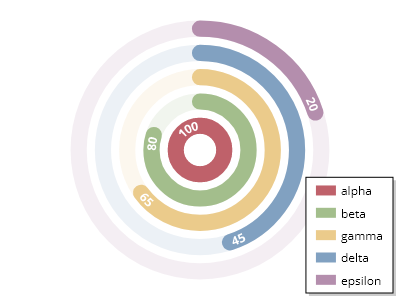
ScottPlot.Plot myPlot = new();
myPlot.Add.Palette = new ScottPlot.Palettes.Nord();
double[] values = { 100, 80, 65, 45, 20 };
var radialGaugePlot = myPlot.Add.RadialGaugePlot(values);
radialGaugePlot.Labels = new string[] { "alpha", "beta", "gamma", "delta", "epsilon" };
myPlot.ShowLegend();
myPlot.SavePng("demo.png", 400, 300);
背景ゲージの淡色表示
背景ゲージの淡色表示
デフォルトでは、各ゲージの全範囲が半透明のリングとして描画されます。透明度は必要に応じて調整できます。
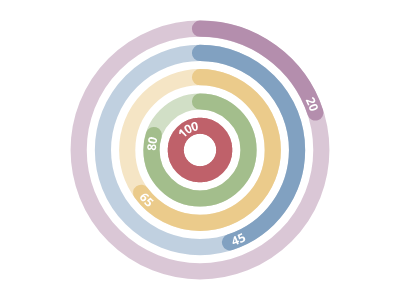
ScottPlot.Plot myPlot = new();
myPlot.Add.Palette = new ScottPlot.Palettes.Nord();
double[] values = { 100, 80, 65, 45, 20 };
var radialGaugePlot = myPlot.Add.RadialGaugePlot(values);
radialGaugePlot.BackgroundTransparencyFraction = .5;
myPlot.SavePng("demo.png", 400, 300);
背景ゲージの正規化
背景ゲージの正規化
ゲージの背景は、デフォルトで完全な円として描画されます。この動作は無効化でき、非円形ゲージに対して部分的な背景を描画できます。
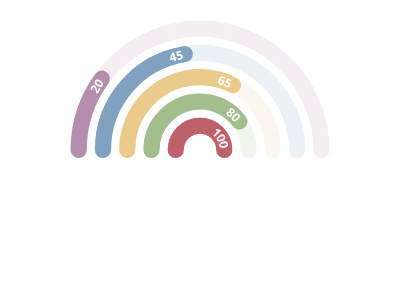
ScottPlot.Plot myPlot = new();
myPlot.Add.Palette = new ScottPlot.Palettes.Nord();
double[] values = { 100, 80, 65, 45, 20 };
var radialGaugePlot = myPlot.Add.RadialGaugePlot(values);
radialGaugePlot.CircularBackground = false;
radialGaugePlot.MaximumAngle = 180;
radialGaugePlot.StartingAngle = 180;
myPlot.SavePng("demo.png", 400, 300);
スケールバー
Scalebars display a horizontal and/or vertical range using a line segment and may be used to convey axis scale as a minimal alternative to using axis frames, ticks, and tick labels.
レシピ
ScaleBar クイックスタート
ScaleBar クイックスタート
ScaleBar をプロットに追加すると、スケール情報を伝えられるため、軸フレーム、目盛り、ラベルを非表示にできます。
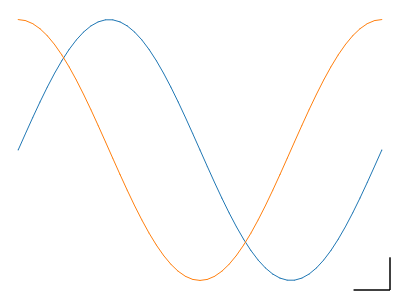
ScottPlot.Plot myPlot = new();
// サンプルデータをプロットする
myPlot.Add.Signal(Generate.Sin());
myPlot.Add.Signal(Generate.Cos());
// スケールバーを追加する
myPlot.Add.ScaleBar(5, 0.25);
// グリッドと軸ラベルを無効にする
myPlot.HideGrid();
myPlot.Axes.Frameless();
myPlot.SavePng("demo.png", 400, 300);
ScaleBar ラベル
ScaleBar ラベル
L 字型のスケールバーの各次元にテキストを追加できます
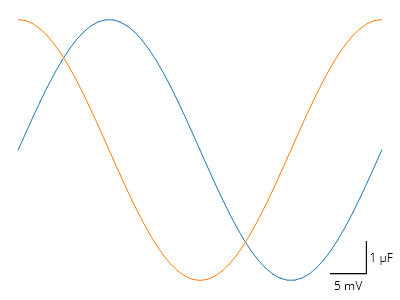
ScottPlot.Plot myPlot = new();
// サンプルデータをプロットする
myPlot.Add.Signal(Generate.Sin());
myPlot.Add.Signal(Generate.Cos());
// スケールバーを追加する
var scalebar = myPlot.Add.ScaleBar(5, 0.25);
scalebar.XLabel = "5 mV";
scalebar.YLabel = "1 µF";
// グリッドと軸ラベルを無効にする
myPlot.HideGrid();
myPlot.Axes.Frameless();
myPlot.SavePng("demo.png", 400, 300);
ScaleBar のスタイル設定
ScaleBar のスタイル設定
ScaleBar にはカスタマイズ可能なプロパティが多数あります
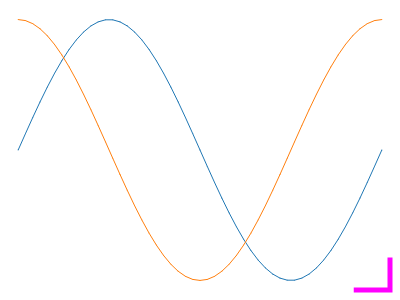
ScottPlot.Plot myPlot = new();
// サンプルデータをプロットする
myPlot.Add.Signal(Generate.Sin());
myPlot.Add.Signal(Generate.Cos());
// スケールバーを追加する
var scalebar = myPlot.Add.ScaleBar(5, 0.25);
scalebar.LineWidth = 5;
scalebar.LineColor = Colors.Magenta;
// グリッドと軸ラベルを無効にする
myPlot.HideGrid();
myPlot.Axes.Frameless();
myPlot.SavePng("demo.png", 400, 300);
ScaleBar 単一次元
ScaleBar 単一次元
Width または Height を 0 に設定すると、ScaleBar は単一の軸のみを使用します
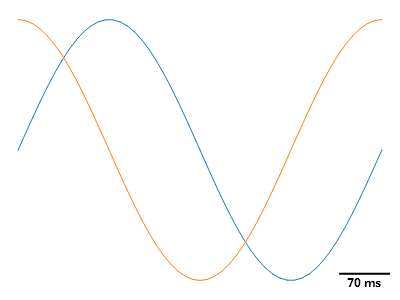
ScottPlot.Plot myPlot = new();
// サンプルデータをプロットする
myPlot.Add.Signal(Generate.Sin());
myPlot.Add.Signal(Generate.Cos());
// スケールバーを追加する
var scalebar = myPlot.Add.ScaleBar(7, 0);
scalebar.LineWidth = 2;
scalebar.XLabel = "70 ms";
scalebar.XLabelStyle.Bold = true;
scalebar.LabelPadding = new(0);
// グリッドと軸ラベルを無効にする
myPlot.HideGrid();
myPlot.Axes.Frameless();
myPlot.SavePng("demo.png", 400, 300);
散布図
Scatter plots display points at X/Y locations in coordinate space.
レシピ
- 散布図クイックスタート
- 散布図の座標
- 散布図のデータ型
- リストデータの散布図
- 線のみの散布図
- 点のみの散布図
- 散布図のスタイリング
- 散布図の線パターン
- Scatter ジェネリック
- 散布図 DateTime
- ステッププロット
- ギャップのある散布図
- 滑らかな線を持つ散布図
- 滑らかな線の張力
- オーバーシュートしない滑らかな散布図
- レンダーインデックスによる表示の制限
- 塗りつぶし付き散布図
- 値まで塗りつぶした散布図
- 上下が塗りつぶされた散布図
- グラデーション塗りつぶし付き散布図
- 垂直グラデーションを使用した散布図
- Scatter のスケールとオフセット
- 積み上げ塗りつぶし折れ線プロット
- シェーディング付き積み上げ散布図
散布図クイックスタート
散布図クイックスタート
散布図は、X 値と Y 値を含む 2 つの配列から作成できます。

ScottPlot.Plot myPlot = new();
double[] xs = { 1, 2, 3, 4, 5 };
double[] ys = { 1, 4, 9, 16, 25 };
myPlot.Add.Scatter(xs, ys);
myPlot.SavePng("demo.png", 400, 300);
散布図の座標
散布図の座標
散布図は、Coordinates のコレクションから作成できます。

ScottPlot.Plot myPlot = new();
Coordinates[] coordinates =
{
new(1, 1),
new(2, 4),
new(3, 9),
new(4, 16),
new(5, 25),
};
myPlot.Add.Scatter(coordinates);
myPlot.SavePng("demo.png", 400, 300);
散布図のデータ型
散布図のデータ型
散布図は、double だけでなく、任意の数値データ型から作成できます。

ScottPlot.Plot myPlot = new();
float[] xs = { 1, 2, 3, 4, 5 };
int[] ys = { 1, 4, 9, 16, 25 };
myPlot.Add.Scatter(xs, ys);
myPlot.SavePng("demo.png", 400, 300);
リストデータの散布図
リストデータの散布図
散布図は List から作成できますが、レンダリング中に項目を追加または削除しないよう十分に注意してください。そうしないと、インデックス例外がスローされる可能性があります。詳細については、Render Lock システムに関するドキュメントを参照してください。

ScottPlot.Plot myPlot = new();
List<double> xs = new() { 1, 2, 3, 4, 5 };
List<double> ys = new() { 1, 4, 9, 16, 25 };
myPlot.Add.Scatter(xs, ys);
myPlot.SavePng("demo.png", 400, 300);
線のみの散布図
線のみの散布図
ScatterLine() メソッドを使用すると、線のみの散布図を作成できます(マーカーサイズは 0 に設定されます)。

ScottPlot.Plot myPlot = new();
double[] xs = Generate.Consecutive(51);
double[] sin = Generate.Sin(51);
double[] cos = Generate.Cos(51);
myPlot.Add.ScatterLine(xs, sin);
myPlot.Add.ScatterLine(xs, cos);
myPlot.SavePng("demo.png", 400, 300);
点のみの散布図
点のみの散布図
ScatterPoints() メソッドを使用すると、マーカーのみの散布図を作成できます(線幅は 0 に設定されます)。
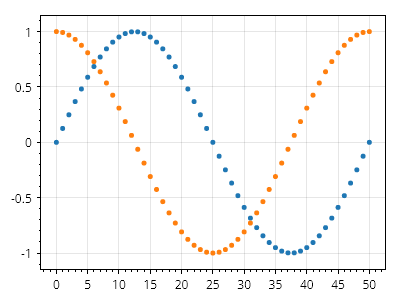
ScottPlot.Plot myPlot = new();
double[] xs = Generate.Consecutive(51);
double[] sin = Generate.Sin(51);
double[] cos = Generate.Cos(51);
myPlot.Add.ScatterPoints(xs, sin);
myPlot.Add.ScatterPoints(xs, cos);
myPlot.SavePng("demo.png", 400, 300);
散布図のスタイリング
散布図のスタイリング
散布図は、散布図を追加した後に返されるオブジェクトを操作することで、広範囲にスタイル設定できます。散布図の Label プロパティにテキストを割り当てると、凡例に表示できるようになります。
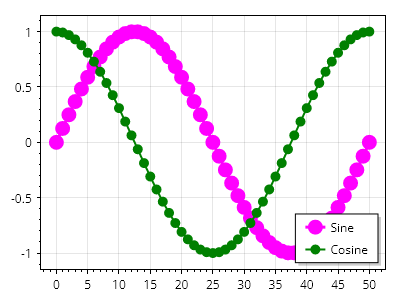
ScottPlot.Plot myPlot = new();
double[] xs = Generate.Consecutive(51);
double[] ys1 = Generate.Sin(51);
double[] ys2 = Generate.Cos(51);
var sp1 = myPlot.Add.Scatter(xs, ys1);
sp1.LegendText = "正弦";
sp1.LineWidth = 3;
sp1.Color = Colors.Magenta;
sp1.MarkerSize = 15;
var sp2 = myPlot.Add.Scatter(xs, ys2);
sp2.LegendText = "余弦";
sp2.LineWidth = 2;
sp2.Color = Colors.Green;
sp2.MarkerSize = 10;
myPlot.ShowLegend();
myPlot.SavePng("demo.png", 400, 300);
散布図の線パターン
散布図の線パターン
いくつかの線パターンを利用できます
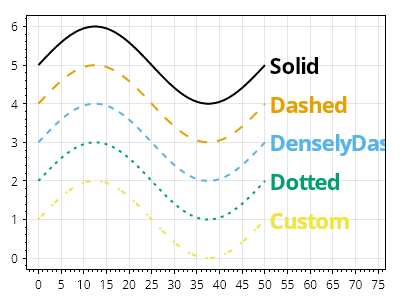
ScottPlot.Plot myPlot = new();
List<LinePattern> patterns = [];
patterns.AddRange(LinePattern.GetAllPatterns());
patterns.Add(new([2, 2, 5, 10], 0, "カスタム"));
ScottPlot.Palettes.ColorblindFriendly palette = new();
for (int i = 0; i < patterns.Count; i++)
{
double yOffset = patterns.Count - i;
double[] xs = Generate.Consecutive(51);
double[] ys = Generate.Sin(51, offset: yOffset);
var sp = myPlot.Add.Scatter(xs, ys);
sp.LineWidth = 2;
sp.MarkerSize = 0;
sp.LinePattern = patterns[i];
sp.Color = palette.GetColor(i);
var txt = myPlot.Add.Text(patterns[i].Name, 51, yOffset);
txt.LabelFontColor = sp.Color;
txt.LabelFontSize = 22;
txt.LabelBold = true;
txt.LabelAlignment = Alignment.MiddleLeft;
}
myPlot.Axes.Margins(.05, .5, .05, .05);
myPlot.SavePng("demo.png", 400, 300);
Scatter ジェネリック
Scatter ジェネリック
散布図はジェネリックデータ型をサポートしていますが、通常は double が最も高性能です。

ScottPlot.Plot myPlot = new();
int[] xs = { 1, 2, 3, 4, 5 };
float[] ys = { 1, 4, 9, 16, 25 };
myPlot.Add.Scatter(xs, ys);
myPlot.SavePng("demo.png", 400, 300);
散布図 DateTime
散布図 DateTime
散布図では DateTime 単位を使用できますが、対応する軸が DateTime 形式で表示されるように必ず設定してください。
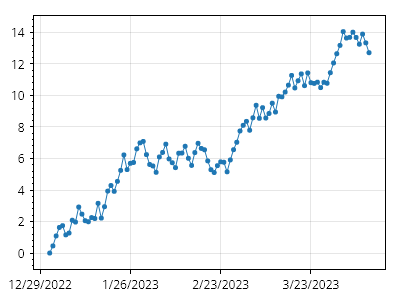
ScottPlot.Plot myPlot = new();
DateTime[] xs = Generate.ConsecutiveDays(100);
double[] ys = Generate.RandomWalk(xs.Length);
myPlot.Add.Scatter(xs, ys);
myPlot.Axes.DateTimeTicksBottom();
myPlot.SavePng("demo.png", 400, 300);
ステッププロット
ステッププロット
散布図は、点を斜めの線ではなく直角で接続するステッププロット表示を使用して作成できます。ステップの方向はカスタマイズできます。
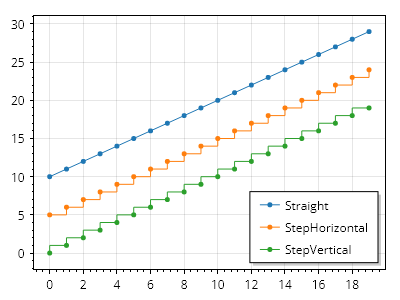
ScottPlot.Plot myPlot = new();
double[] xs = Generate.Consecutive(20);
double[] ys1 = Generate.Consecutive(20, first: 10);
double[] ys2 = Generate.Consecutive(20, first: 5);
double[] ys3 = Generate.Consecutive(20, first: 0);
var sp1 = myPlot.Add.Scatter(xs, ys1);
sp1.ConnectStyle = ConnectStyle.Straight;
sp1.LegendText = "直線";
var sp2 = myPlot.Add.Scatter(xs, ys2);
sp2.ConnectStyle = ConnectStyle.StepHorizontal;
sp2.LegendText = "水平ステップ";
var sp3 = myPlot.Add.Scatter(xs, ys3);
sp3.ConnectStyle = ConnectStyle.StepVertical;
sp3.LegendText = "垂直ステップ";
myPlot.ShowLegend();
myPlot.SavePng("demo.png", 400, 300);
ギャップのある散布図
ギャップのある散布図
散布図のデータ内の NaN 値は、線のギャップとして表示されます。
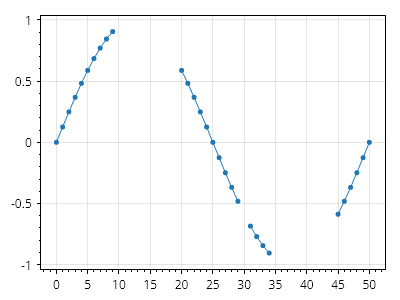
ScottPlot.Plot myPlot = new();
double[] xs = Generate.Consecutive(51);
double[] ys = Generate.Sin(51);
// 空データの長い区間
for (int i = 10; i < 20; i++)
ys[i] = double.NaN;
// 単一の欠損データ点
ys[30] = double.NaN;
// 単一の孤立したデータ点
for (int i = 35; i < 40; i++)
ys[i] = double.NaN;
for (int i = 40; i < 45; i++)
ys[i] = double.NaN;
myPlot.Add.Scatter(xs, ys);
myPlot.SavePng("demo.png", 400, 300);
滑らかな線を持つ散布図
滑らかな線を持つ散布図
散布図はデフォルトで点の間に直線を描画しますが、Smooth プロパティを設定すると、散布図は滑らかな線で点を接続できます。線は三次スプライン補間を使用して平滑化されます。
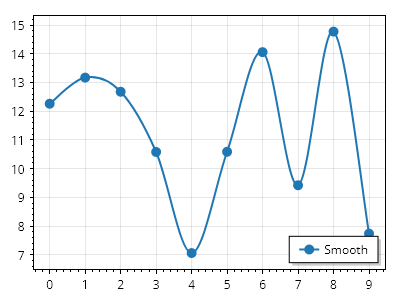
ScottPlot.Plot myPlot = new();
double[] xs = Generate.Consecutive(10);
double[] ys = Generate.RandomSample(10, 5, 15);
var sp = myPlot.Add.Scatter(xs, ys);
sp.Smooth = true;
sp.LegendText = "Smooth";
sp.LineWidth = 2;
sp.MarkerSize = 10;
myPlot.SavePng("demo.png", 400, 300);
滑らかな線の張力
滑らかな線の張力
一部の平滑化戦略では、滑らかな線の張力を調整できます。低い張力では「オーバーシュート」が発生し、高い張力では曲線がより直線に近く見えます。
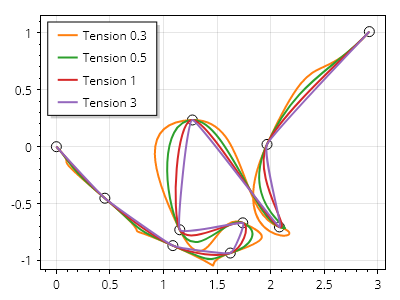
ScottPlot.Plot myPlot = new();
double[] xs = Generate.RandomWalk(10);
double[] ys = Generate.RandomWalk(10);
var mk = myPlot.Add.Markers(xs, ys);
mk.MarkerShape = MarkerShape.OpenCircle;
mk.Color = Colors.Black;
double[] tensions = { 0.3, 0.5, 1.0, 3.0 };
foreach (double tension in tensions)
{
var sp = myPlot.Add.ScatterLine(xs, ys);
sp.Smooth = true;
sp.SmoothTension = tension;
sp.LegendText = $"Tension {tension}";
sp.LineWidth = 2;
}
myPlot.ShowLegend(Alignment.UpperLeft);
myPlot.SavePng("demo.png", 400, 300);
オーバーシュートしない滑らかな散布図
オーバーシュートしない滑らかな散布図
二次半点パス戦略を使用すると、点を結ぶ滑らかな線で散布図を表示できますが、線は各点への入りと出がイージングされるため、垂直方向に値を「オーバーシュート」することはありません。
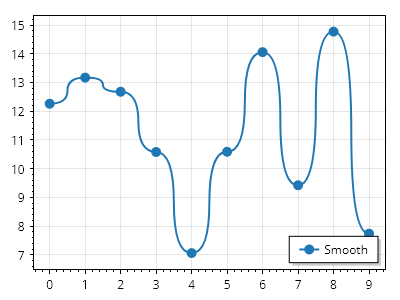
ScottPlot.Plot myPlot = new();
double[] xs = Generate.Consecutive(10);
double[] ys = Generate.RandomSample(10, 5, 15);
var sp = myPlot.Add.Scatter(xs, ys);
sp.PathStrategy = new ScottPlot.PathStrategies.QuadHalfPoint();
sp.LegendText = "滑らか";
sp.LineWidth = 2;
sp.MarkerSize = 10;
myPlot.SavePng("demo.png", 400, 300);
レンダーインデックスによる表示の制限
レンダーインデックスによる表示の制限
散布図には非常に大量のデータが含まれる場合がありますが、その多くは未入力である可能性があります。ユーザーは最小および最大レンダーインデックスを定義でき、散布図がレンダリングされる際には、その範囲内の値のみが表示されます。
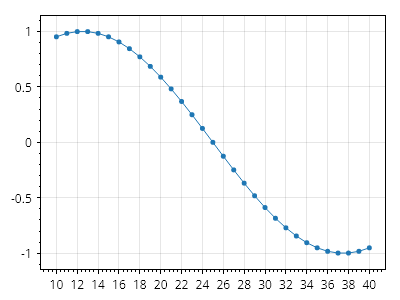
ScottPlot.Plot myPlot = new();
double[] xs = Generate.Consecutive(51);
double[] ys = Generate.Sin(51);
var sp = myPlot.Add.Scatter(xs, ys);
sp.MinRenderIndex = 10;
sp.MaxRenderIndex = 40;
myPlot.SavePng("demo.png", 400, 300);
塗りつぶし付き散布図
塗りつぶし付き散布図
散布図の下の領域を塗りつぶすことができます。
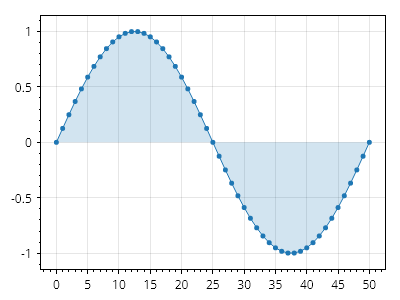
ScottPlot.Plot myPlot = new();
double[] xs = Generate.Consecutive(51);
double[] ys = Generate.Sin(51);
var sp = myPlot.Add.Scatter(xs, ys);
sp.FillY = true;
sp.FillYColor = sp.Color.WithAlpha(.2);
myPlot.SavePng("demo.png", 400, 300);
値まで塗りつぶした散布図
値まで塗りつぶした散布図
塗りつぶしの基準を定義できます。
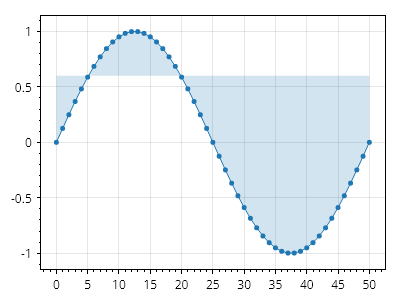
ScottPlot.Plot myPlot = new();
double[] xs = Generate.Consecutive(51);
double[] ys = Generate.Sin(51);
var sp = myPlot.Add.Scatter(xs, ys);
sp.FillY = true;
sp.FillYColor = sp.Color.WithAlpha(.2);
sp.FillYValue = 0.6;
myPlot.SavePng("demo.png", 400, 300);
上下が塗りつぶされた散布図
上下が塗りつぶされた散布図
FillY 値の上側と下側の塗りつぶし領域は、個別にカスタマイズできます
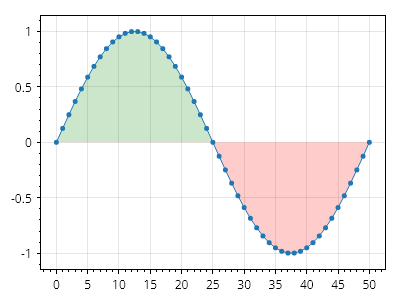
ScottPlot.Plot myPlot = new();
double[] xs = Generate.Consecutive(51);
double[] ys = Generate.Sin(51);
var sp = myPlot.Add.Scatter(xs, ys);
sp.FillY = true;
sp.FillYValue = 0;
sp.FillYAboveColor = Colors.Green.WithAlpha(.2);
sp.FillYBelowColor = Colors.Red.WithAlpha(.2);
myPlot.SavePng("demo.png", 400, 300);
グラデーション塗りつぶし付き散布図
グラデーション塗りつぶし付き散布図
散布図の下の領域は、カスタムの色グラデーションで塗りつぶすことができます。
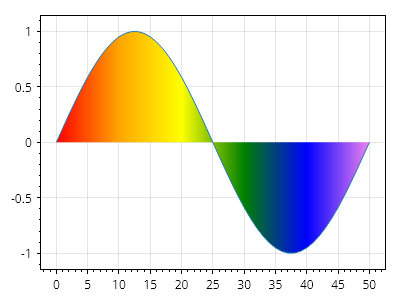
ScottPlot.Plot myPlot = new();
double[] xs = Generate.Consecutive(51);
double[] ys = Generate.Sin(51);
var poly = myPlot.Add.ScatterLine(xs, ys);
poly.FillY = true;
// 色はX軸上の特定の位置に配置されます
poly.AxisGradientDirection = AxisGradientDirection.Horizontal;
poly.ColorPositions.Add(new(Colors.Red, 0));
poly.ColorPositions.Add(new(Colors.Orange, 10));
poly.ColorPositions.Add(new(Colors.Yellow, 20));
poly.ColorPositions.Add(new(Colors.Green, 30));
poly.ColorPositions.Add(new(Colors.Blue, 40));
poly.ColorPositions.Add(new(Colors.Violet, 50));
myPlot.SavePng("demo.png", 400, 300);
垂直グラデーションを使用した散布図
垂直グラデーションを使用した散布図
散布図は垂直グラデーションで塗りつぶすことができます。
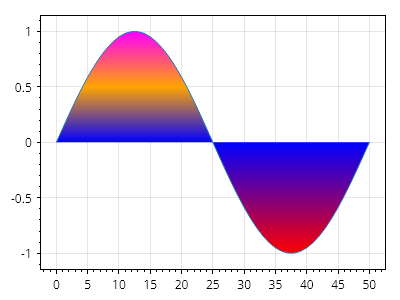
ScottPlot.Plot myPlot = new();
double[] xs = Generate.Consecutive(51);
double[] ys = Generate.Sin(51);
var poly = myPlot.Add.ScatterLine(xs, ys);
poly.FillY = true;
// 色はY軸上の特定の位置に配置されます
poly.AxisGradientDirection = AxisGradientDirection.Vertical;
poly.ColorPositions.Add(new(Colors.Red, -1));
poly.ColorPositions.Add(new(Colors.Blue, 0));
poly.ColorPositions.Add(new(Colors.Orange, .5));
poly.ColorPositions.Add(new(Colors.Magenta, 1));
myPlot.SavePng("demo.png", 400, 300);
Scatter のスケールとオフセット
Scatter のスケールとオフセット
散布図の点には、カスタムの X および Y スケール係数を乗算したり、X および Y オフセット値を使用して水平方向または垂直方向に移動したりできます。
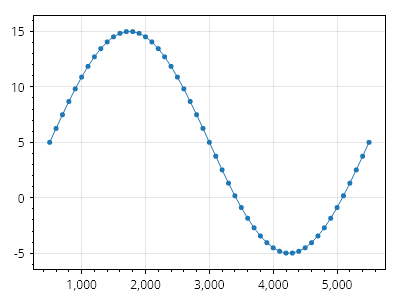
ScottPlot.Plot myPlot = new();
double[] xs = Generate.Consecutive(51);
double[] ys = Generate.Sin(51);
var sp = myPlot.Add.Scatter(xs, ys);
sp.ScaleX = 100;
sp.ScaleY = 10;
sp.OffsetX = 500;
sp.OffsetY = 5;
myPlot.SavePng("demo.png", 400, 300);
積み上げ塗りつぶし折れ線プロット
積み上げ塗りつぶし折れ線プロット
積み上げ塗りつぶし折れ線プロットの効果は、領域を塗りつぶす ScatterLine を重ねることで実現できます。
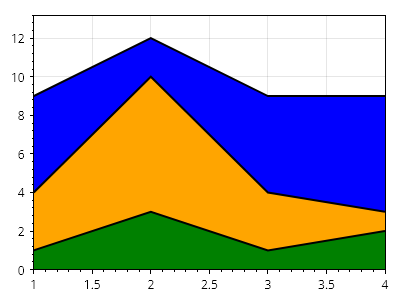
ScottPlot.Plot myPlot = new();
// サンプルデータを作成する
double[] xs = { 1, 2, 3, 4 };
double[] ys1 = { 1, 3, 1, 2 };
double[] ys2 = { 3, 7, 3, 1 };
double[] ys3 = { 5, 2, 5, 6 };
// 各プロットを、それより前のすべてのプロットの合計分だけ垂直方向にシフトする
ys2 = Enumerable.Range(0, ys2.Length).Select(x => ys2[x] + ys1[x]).ToArray();
ys3 = Enumerable.Range(0, ys2.Length).Select(x => ys3[x] + ys2[x]).ToArray();
// パディングされたデータポイントを ScatterLine としてプロットする
var sp3 = myPlot.Add.ScatterLine(xs, ys3, Colors.Black);
var sp2 = myPlot.Add.ScatterLine(xs, ys2, Colors.Black);
var sp1 = myPlot.Add.ScatterLine(xs, ys1, Colors.Black);
// プロットのスタイルを設定する
sp1.LineWidth = 2;
sp2.LineWidth = 2;
sp3.LineWidth = 2;
sp1.FillY = true;
sp2.FillY = true;
sp3.FillY = true;
sp1.FillYColor = Colors.Green;
sp2.FillYColor = Colors.Orange;
sp3.FillYColor = Colors.Blue;
// データがプロットの端まで届くように狭い余白を使用する
myPlot.Axes.Margins(0, 0, 0, 0.1);
myPlot.SavePng("demo.png", 400, 300);
シェーディング付き積み上げ散布図
シェーディング付き積み上げ散布図
塗りつぶし散布図に垂直方向および水平方向のオフセットを組み合わせて、興味深い視覚効果を実現する方法を示します。
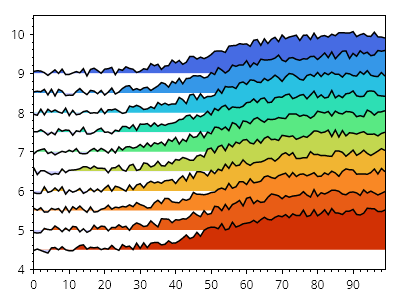
ScottPlot.Plot myPlot = new();
double[] xs = ScottPlot.Generate.Consecutive(100);
ScottPlot.Colormaps.MellowRainbow cmap = new();
for (int i = 0; i < 10; i++)
{
double yOffset = 9 - i * 0.5;
double[] ys = Generate.Sigmoidal(xs.Length)
.Select(y => y + yOffset)
.ToArray();
Generate.AddNoiseInPlace(ys, 0.1);
var sig = myPlot.Add.ScatterLine(xs, ys);
sig.LineColor = Colors.Black;
sig.LineWidth = 1.5f;
sig.FillY = true;
sig.FillYValue = yOffset;
sig.FillYAboveColor = cmap.GetColor(i, 10);
}
myPlot.HideGrid();
myPlot.Axes.MarginsX(0);
myPlot.SavePng("demo.png", 400, 300);
図形
Basic shapes that can be added to plots
レシピ
長方形
長方形
長方形をプロットに追加し、必要に応じてスタイルを設定できます。
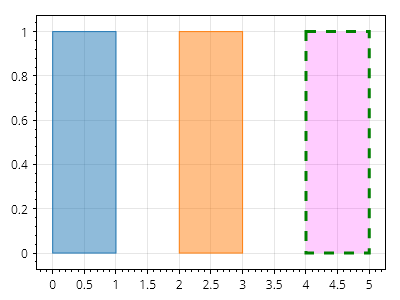
ScottPlot.Plot myPlot = new();
// 点を指定して長方形を追加する
myPlot.Add.Rectangle(0, 1, 0, 1);
// より表現力の高い図形を使用して長方形を追加する
Coordinates location = new(2, 0);
CoordinateSize size = new(1, 1);
CoordinateRect rect = new(location, size);
myPlot.Add.Rectangle(rect);
// プロットに追加した後で長方形のスタイルを設定する
var rp = myPlot.Add.Rectangle(4, 5, 0, 1);
rp.FillStyle.Color = Colors.Magenta.WithAlpha(.2);
rp.LineStyle.Color = Colors.Green;
rp.LineStyle.Width = 3;
rp.LineStyle.Pattern = LinePattern.Dashed;
myPlot.SavePng("demo.png", 400, 300);
円
円
円はプロット上に配置でき、必要に応じてスタイルを設定できます。
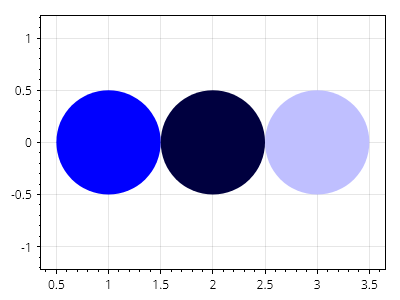
ScottPlot.Plot myPlot = new();
var c1 = myPlot.Add.Circle(1, 0, .5);
var c2 = myPlot.Add.Circle(2, 0, .5);
var c3 = myPlot.Add.Circle(3, 0, .5);
c1.FillStyle.Color = Colors.Blue;
c2.FillStyle.Color = Colors.Blue.Darken(.75);
c3.FillStyle.Color = Colors.Blue.Lighten(.75);
c1.LineWidth = 0;
c2.LineWidth = 0;
c3.LineWidth = 0;
// 円が円のまま維持されるように強制する
ScottPlot.AxisRules.SquareZoomOut squareRule = new(myPlot.Axes.Bottom, myPlot.Axes.Left);
myPlot.Axes.Rules.Add(squareRule);
myPlot.SavePng("demo.png", 400, 300);
楕円
楕円
楕円はプロット上に配置でき、必要に応じてスタイルを設定できます。
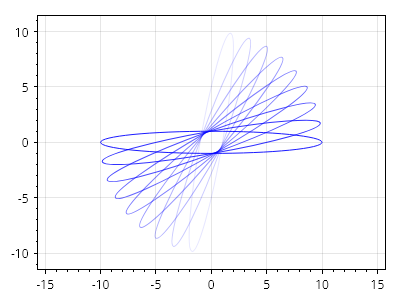
ScottPlot.Plot myPlot = new();
for (int i = 0; i < 10; i++)
{
var el = myPlot.Add.Ellipse(0, 0, 1, 10, rotation: Angle.FromDegrees(i * -10));
double fraction = i / 10.0;
el.LineColor = Colors.Blue.WithAlpha(fraction);
}
// 円が円のまま維持されるように強制する
ScottPlot.AxisRules.SquareZoomOut squareRule = new(myPlot.Axes.Bottom, myPlot.Axes.Left);
myPlot.Axes.Rules.Add(squareRule);
myPlot.SavePng("demo.png", 400, 300);
ポリゴンプロットのクイックスタート
ポリゴンプロットのクイックスタート
ポリゴンプロットは一連の頂点から追加でき、時計回りの順序でなければなりません。
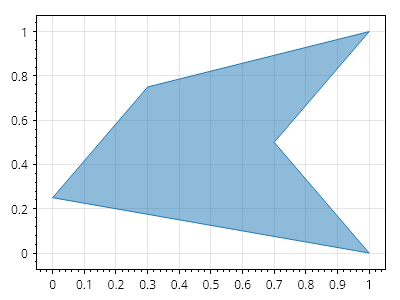
ScottPlot.Plot myPlot = new();
Coordinates[] points =
{
new(0, 0.25),
new(0.3, 0.75),
new(1, 1),
new(0.7, 0.5),
new(1, 0)
};
myPlot.Add.Polygon(points);
myPlot.SavePng("demo.png", 400, 300);
ポリゴンプロットのスタイリング
ポリゴンプロットのスタイリング
ポリゴンプロットは完全にカスタマイズできます。
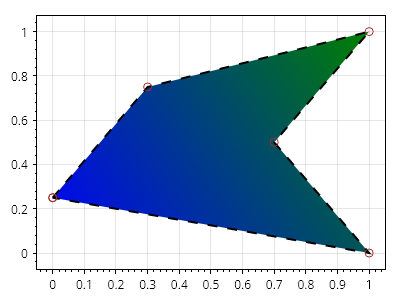
ScottPlot.Plot myPlot = new();
Coordinates[] points =
{
new (0, 0.25),
new (0.3, 0.75),
new (1, 1),
new (0.7, 0.5),
new (1, 0)
};
var poly = myPlot.Add.Polygon(points);
poly.FillColor = Colors.Green;
poly.FillHatchColor = Colors.Blue;
poly.FillHatch = new Gradient()
{
GradientType = GradientType.Linear,
AlignmentStart = Alignment.UpperRight,
AlignmentEnd = Alignment.LowerLeft,
};
poly.LineColor = Colors.Black;
poly.LinePattern = LinePattern.Dashed;
poly.LineWidth = 2;
poly.MarkerShape = MarkerShape.OpenCircle;
poly.MarkerSize = 8;
poly.MarkerFillColor = Colors.Gold;
poly.MarkerLineColor = Colors.Brown;
myPlot.SavePng("demo.png", 400, 300);
積み上げ折れ線グラフ
積み上げ折れ線グラフ
積み上げ折れ線グラフは、プリミティブ図形をプロット上で組み合わせることで実現できます。
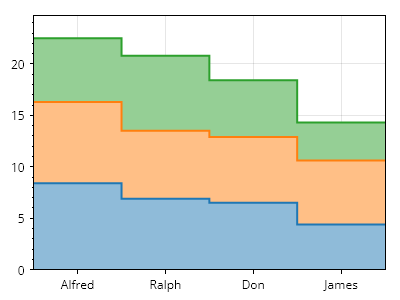
ScottPlot.Plot myPlot = new();
// 各線の値を準備する
double[] values1 = [8.4, 6.9, 6.5, 4.4];
double[] values2 = [7.9, 6.6, 6.4, 6.2];
double[] values3 = [6.2, 7.3, 5.5, 3.7];
// 各線の値を保持するコレクションを作成する
double[][] allValues = [values1, values2, values3];
// 各点を2回格納することで、各線のステップ点を計算する
double[] runningSum = new double[values1.Length];
for (int i = 0; i < allValues.Length; i++)
{
// 積み上げ効果を実現するために、実行合計の上に値を追加する
runningSum = DataOperations.SumVertically([runningSum, allValues[i]]);
List<Coordinates> points = [];
for (int j = 0; j < runningSum.Length; j++)
{
points.Add(new(j, runningSum[j]));
points.Add(new(j + 1, runningSum[j]));
}
// 線を表示するために、点をそのままプロットする
Coordinates[] lineCoordinates = [.. points];
// 開始点と終了点を追加する
points.Add(new(points.Last().X, 0));
points.Add(new(points.First().X, 0));
Coordinates[] fillCoordinates = [.. points];
// ポリゴンを追加し、その上に線を重ねる
var line = myPlot.Add.ScatterLine(lineCoordinates);
line.Color = ScottPlot.Palette.Default.GetColor(i);
line.LineWidth = 2;
var poly = myPlot.Add.Polygon(fillCoordinates);
poly.FillColor = line.Color.Lighten(.5);
poly.LineWidth = 0;
}
// すべての順序を反転し、最小のポリゴン
// (最初に追加されたもの)が上に表示され、最後に描画されるようにする
myPlot.PlottableList.Reverse();
// データとプロット端の間のパディングを防ぐために、狭い余白を使用する
myPlot.Axes.Margins(0, 0, 0, 0.1);
// グループラベルを追加する
double[] positions = [0.5, 1.5, 2.5, 3.5];
string[] labels = { "Alfred", "Ralph", "Don", "James" };
myPlot.Axes.Bottom.SetTicks(positions, labels);
myPlot.SavePng("demo.png", 400, 300);
円弧
円弧
円弧は、円周の一部に沿った曲線です。円は右端から始まり、反時計回りに伸びます。
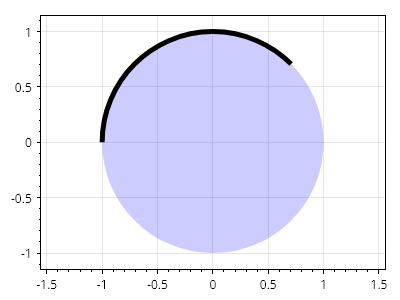
ScottPlot.Plot myPlot = new();
Coordinates center = new(0, 0);
double radius = 1.0;
Angle start = Angle.FromDegrees(45);
Angle sweep = Angle.FromDegrees(135);
var circle = myPlot.Add.Circle(center, radius);
circle.FillColor = Colors.Blue.WithAlpha(.2);
circle.LineWidth = 0;
var arc = myPlot.Add.Arc(center, radius, start, sweep);
arc.LineWidth = 5;
arc.LineColor = Colors.Black;
myPlot.Axes.SquareUnits(); // 円が引き伸ばされないように正方形単位を使用する
myPlot.SavePng("demo.png", 400, 300);
楕円弧
楕円弧
楕円弧は、楕円の円周の一部に沿った曲線です。楕円は右端から始まり、反時計回りに延びます。
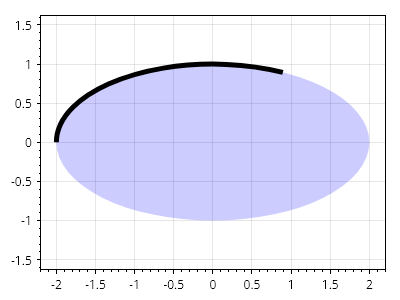
ScottPlot.Plot myPlot = new();
Coordinates center = new(0, 0);
double radiusX = 2.0;
double radiusY = 1.0;
Angle start = Angle.FromDegrees(45);
Angle sweep = Angle.FromDegrees(135);
var ellipse = myPlot.Add.Ellipse(center, radiusX, radiusY);
ellipse.FillColor = Colors.Blue.WithAlpha(.2);
ellipse.LineWidth = 0;
var arc = myPlot.Add.EllipticalArc(center, radiusX, radiusY, start, sweep);
arc.LineWidth = 5;
arc.LineColor = Colors.Black;
myPlot.Axes.SquareUnits(); // 円が引き伸ばされないように正方形単位を使用する
myPlot.SavePng("demo.png", 400, 300);
円の扇形
円の扇形
円の扇形は、円周上の弧と中心点の間にある円の内側の領域によって形成される2D形状です。
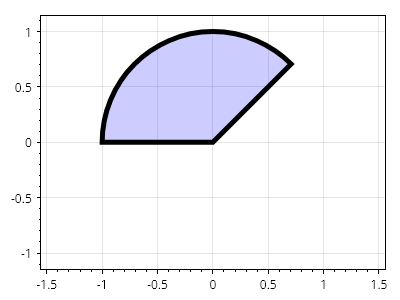
ScottPlot.Plot myPlot = new();
Coordinates center = new(0, 0);
double radius = 1.0;
Angle start = Angle.FromDegrees(45);
Angle sweep = Angle.FromDegrees(135);
var cs = myPlot.Add.CircleSector(center, radius, start, sweep);
cs.FillColor = Colors.Blue.WithAlpha(.2);
cs.LineColor = Colors.Black;
cs.LineWidth = 5;
myPlot.Axes.SquareUnits(); // 円が引き伸ばされないように正方形の単位を使用する
myPlot.SavePng("demo.png", 400, 300);
楕円扇形
楕円扇形
楕円扇形は、楕円の内側で、その外周に沿った弧と中心点との間の領域によって形成される2D形状です。
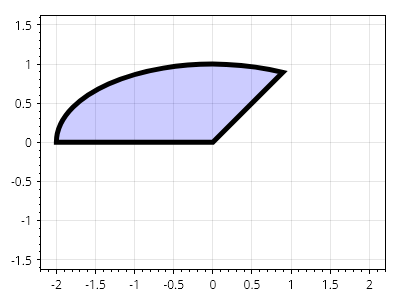
ScottPlot.Plot myPlot = new();
Coordinates center = new(0, 0);
double radiusX = 2.0;
double radiusY = 1.0;
Angle start = Angle.FromDegrees(45);
Angle sweep = Angle.FromDegrees(135);
var cs = myPlot.Add.EllipticalSector(center, radiusX, radiusY, start, sweep);
cs.FillColor = Colors.Blue.WithAlpha(.2);
cs.LineColor = Colors.Black;
cs.LineWidth = 5;
myPlot.Axes.SquareUnits(); // 円が引き伸ばされないように正方形単位を使用する
myPlot.SavePng("demo.png", 400, 300);
環状扇形
環状扇形
環状扇形は、2つの円の間にある2D図形(ドーナツのような形)で、中心点を基準とした2つの角度の間の領域だけを含むように切り取ることができます。
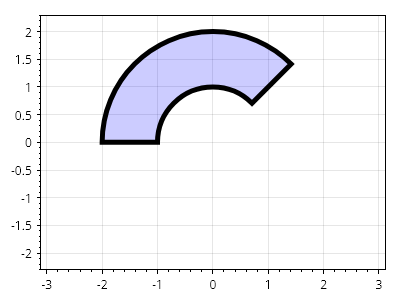
ScottPlot.Plot myPlot = new();
Coordinates center = new(0, 0);
double outerRadius = 2.0;
double innerRadius = 1.0;
Angle start = Angle.FromDegrees(45);
Angle sweep = Angle.FromDegrees(135);
var cs = myPlot.Add.AnnularSector(center, outerRadius, innerRadius, start, sweep);
cs.FillColor = Colors.Blue.WithAlpha(.2);
cs.LineColor = Colors.Black;
cs.LineWidth = 5;
myPlot.Axes.SquareUnits(); // 円が引き伸ばされないように正方形の単位を使用する
myPlot.SavePng("demo.png", 400, 300);
環状楕円扇形
環状楕円扇形
環状楕円扇形は、2つの楕円の間にある2D形状であり、中心点を基準とした2つの角度の間の領域のみを含むように切り出すことができます。
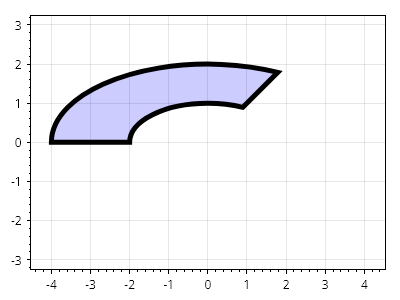
ScottPlot.Plot myPlot = new();
Coordinates center = new(0, 0);
double outerRadiusX = 4.0;
double outerRadiusY = 2.0;
double innerRadiusX = 2.0;
double innerRadiusY = 1.0;
Angle start = Angle.FromDegrees(45);
Angle sweep = Angle.FromDegrees(135);
var cs = myPlot.Add.AnnularEllipticalSector(center, outerRadiusX, outerRadiusY, innerRadiusX, innerRadiusY, start, sweep);
cs.FillColor = Colors.Blue.WithAlpha(.2);
cs.LineColor = Colors.Black;
cs.LineWidth = 5;
myPlot.Axes.SquareUnits(); // 円が引き伸ばされないように正方単位を使用する
myPlot.SavePng("demo.png", 400, 300);
シグナルプロット
Signal plots display evenly-spaced data
レシピ
- Signal プロットのクイックスタート
- Signal プロットのスタイル設定
- Signal オフセット
- 信号のスケーリング
- シグナルマーカーサイズ
- 部分的なシグナルレンダリング
- Signal Generic
- Signal DateTime
Signal プロットのクイックスタート
Signal プロットのクイックスタート
Signal プロットは、非常に大規模なデータセットに最適です。数百万のデータポイントを含むプロットで高速なインタラクティブ操作を可能にする特別な最適化を使用してレンダリングします。
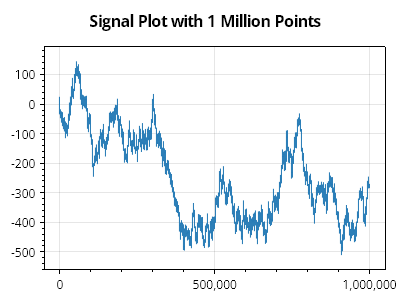
ScottPlot.Plot myPlot = new();
double[] values = Generate.RandomWalk(1_000_000);
myPlot.Add.Signal(values);
myPlot.Title("100 万点の Signal プロット");
myPlot.SavePng("demo.png", 400, 300);
Signal プロットのスタイル設定
Signal プロットのスタイル設定
Signal プロットはさまざまな方法でスタイル設定できます。
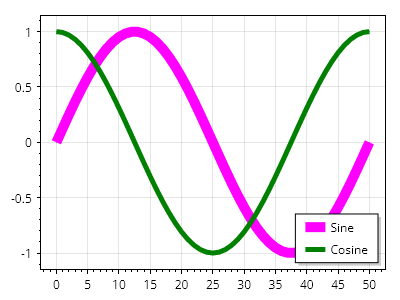
ScottPlot.Plot myPlot = new();
var sig1 = myPlot.Add.Signal(Generate.Sin());
sig1.Color = Colors.Magenta;
sig1.LineWidth = 10;
sig1.LegendText = "サイン";
var sig2 = myPlot.Add.Signal(Generate.Cos());
sig2.Color = Colors.Green;
sig2.LineWidth = 5;
sig2.LegendText = "コサイン";
myPlot.ShowLegend();
myPlot.SavePng("demo.png", 400, 300);
Signal オフセット
Signal オフセット
Signal プロットは、指定された X 値と Y 値でオフセットできます。
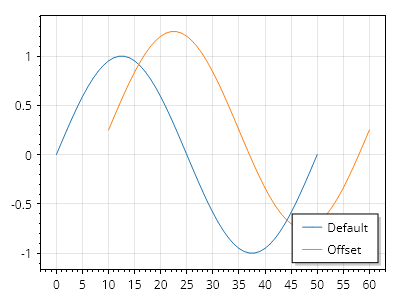
ScottPlot.Plot myPlot = new();
double[] values = ScottPlot.Generate.Sin(51);
var sig1 = myPlot.Add.Signal(values);
sig1.LegendText = "デフォルト";
var sig2 = myPlot.Add.Signal(values);
sig2.Data.XOffset = 10;
sig2.Data.YOffset = .25;
sig2.LegendText = "オフセット";
myPlot.Legend.IsVisible = true;
myPlot.SavePng("demo.png", 400, 300);
信号のスケーリング
信号のスケーリング
信号プロットは、ユーザー定義の量に応じて垂直方向にスケーリングできます。

ScottPlot.Plot myPlot = new();
// -1 から 1 までの値をプロットする
double[] values = ScottPlot.Generate.Sin(51);
var signal = myPlot.Add.Signal(values);
// 垂直方向のスケーリングを増やす
signal.Data.YScale = 500;
myPlot.SavePng("demo.png", 400, 300);
シグナルマーカーサイズ
シグナルマーカーサイズ
シグナルプロットでは、プロットを拡大したときにのみ表示されるマーカーを各点に表示できます。
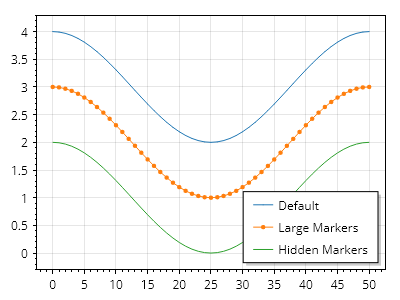
ScottPlot.Plot myPlot = new();
var sig1 = myPlot.Add.Signal(Generate.Cos());
sig1.LegendText = "デフォルト";
sig1.Data.YOffset = 3;
var sig2 = myPlot.Add.Signal(Generate.Cos());
sig2.LegendText = "大きなマーカー";
sig2.MaximumMarkerSize = 20;
sig2.Data.YOffset = 2;
var sig3 = myPlot.Add.Signal(Generate.Cos());
sig3.LegendText = "非表示のマーカー";
sig3.MaximumMarkerSize = 0;
sig3.Data.YOffset = 1;
myPlot.Legend.IsVisible = true;
myPlot.SavePng("demo.png", 400, 300);
部分的なシグナルレンダリング
部分的なシグナルレンダリング
シグナルプロットが大きなデータ配列を参照している場合でも、レンダリングを値の範囲に制限できます。設定した場合、最小レンダリングインデックスと最大レンダリングインデックスの間のデータ範囲のみが表示されます。
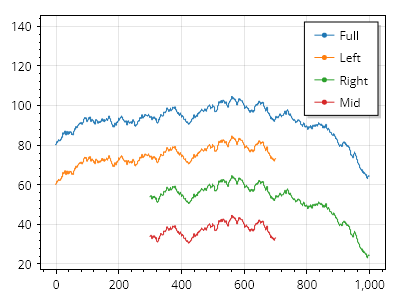
ScottPlot.Plot myPlot = new();
double[] values = Generate.RandomWalk(1000);
var sigAll = myPlot.Add.Signal(values);
sigAll.LegendText = "全体";
sigAll.Data.YOffset = 80;
var sigLeft = myPlot.Add.Signal(values);
sigLeft.LegendText = "左";
sigLeft.Data.YOffset = 60;
sigLeft.Data.MaximumIndex = 700;
var sigRight = myPlot.Add.Signal(values);
sigRight.LegendText = "右";
sigRight.Data.YOffset = 40;
sigRight.Data.MinimumIndex = 300;
var sigMid = myPlot.Add.Signal(values);
sigMid.LegendText = "中央";
sigMid.Data.YOffset = 20;
sigMid.Data.MinimumIndex = 300;
sigMid.Data.MaximumIndex = 700;
myPlot.ShowLegend(Alignment.UpperRight);
myPlot.Axes.Margins(top: .5);
myPlot.SavePng("demo.png", 400, 300);
Signal Generic
Signal Generic
信号プロットは汎用データ型をサポートしていますが、通常は double が最も高性能です。
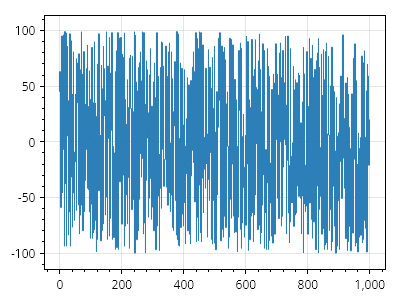
ScottPlot.Plot myPlot = new();
int[] values = Generate.RandomIntegers(1000, -100, 100);
myPlot.Add.Signal(values);
myPlot.SavePng("demo.png", 400, 300);
Signal DateTime
Signal DateTime
シグナルプロットでは DateTime 単位を使用できますが、対応する軸を DateTime 形式で表示するように必ず設定してください。
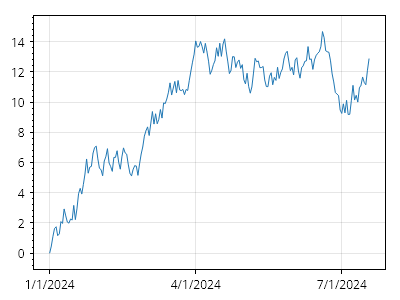
ScottPlot.Plot myPlot = new();
DateTime start = new(2024, 1, 1);
double[] ys = Generate.RandomWalk(200);
var sig = myPlot.Add.Signal(ys);
sig.Data.XOffset = start.ToOADate();
sig.Data.Period = 1.0; // 各点の間隔は1日
myPlot.Axes.DateTimeTicksBottom();
myPlot.SavePng("demo.png", 400, 300);
SignalConst
SignalConst is a type of signal plot which contains immutable data points and occupies more memory but offers greater performance for extremely large datasets. It is rarely needed, but best use for plotting data containing millions of points.
レシピ
SignalConst クイックスタート
SignalConst クイックスタート
SignalConst は、高いフレームレートで数百万点のデータを表示でき、大規模なデータセットのインタラクティブな操作に最適です。

ScottPlot.Plot myPlot = new();
double[] data = Generate.RandomWalk(1_000_000);
myPlot.Add.SignalConst(data);
myPlot.SavePng("demo.png", 400, 300);
SignalXY プロット
SignalXY are a high performance plot type optimized for X/Y pairs where the X values are always ascending. For large datasets SignalXY plots are much more performant than Scatter plots (which allow unordered X points) but not as performant as Signal plots (which require fixed spacing between X points).
レシピ
- SignalXY クイックスタート
- SignalXY ジェネリック配列
- SignalXY 汎用リスト
- SignalXY DateTime 軸
- 部分的な SignalXY レンダリング
- SignalXY オフセット
- SignalXY のスケーリング
- 垂直 SignalXY
- X 軸が反転した垂直 SignalXY
- Y 軸を反転した垂直 SignalXY
- マーカー付き SignalXY
SignalXY クイックスタート
SignalXY クイックスタート
SignalXY プロットは、X 値が常に昇順である X/Y データ向けの高性能なプロットタイプです。
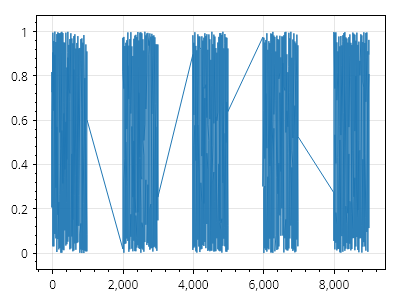
ScottPlot.Plot myPlot = new();
// 欠損を含むサンプルデータを生成する
List<double> xList = new();
List<double> yList = new();
for (int i = 0; i < 5; i++)
{
xList.AddRange(Generate.Consecutive(1000, first: 2000 * i));
yList.AddRange(Generate.RandomSample(1000));
}
double[] xs = xList.ToArray();
double[] ys = yList.ToArray();
// SignalXY プロットを追加する
myPlot.Add.SignalXY(xs, ys);
myPlot.SavePng("demo.png", 400, 300);
SignalXY ジェネリック配列
SignalXY ジェネリック配列
SignalXY プロットはジェネリックデータ型の配列をサポートしますが、通常は double が最も高性能です。
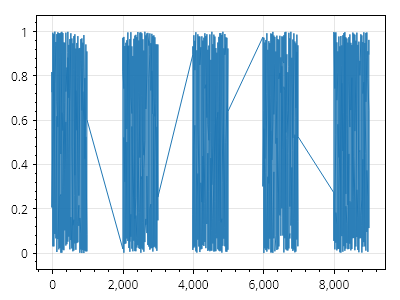
ScottPlot.Plot myPlot = new();
// 欠損のあるサンプルデータを生成する
List<int> xList = new();
List<float> yList = new();
for (int i = 0; i < 5; i++)
{
xList.AddRange(Generate.Consecutive(1000, first: 2000 * i).Select(x => (int)x));
yList.AddRange(Generate.RandomSample(1000).Select(x => (float)x));
}
// この例では変換する
int[] xs = xList.ToArray();
float[] ys = yList.ToArray();
// SignalXY プロットを追加する
myPlot.Add.SignalXY(xs, ys);
myPlot.SavePng("demo.png", 400, 300);
SignalXY 汎用リスト
SignalXY 汎用リスト
SignalXY プロットは汎用リストをサポートしています。
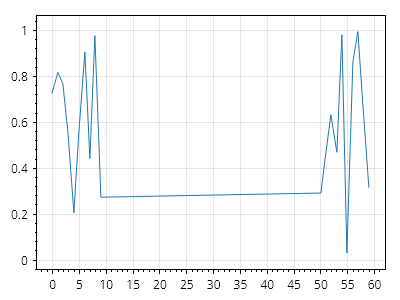
ScottPlot.Plot myPlot = new();
// 初期データを含む X と Y のリストを作成する
List<double> xs = new(Generate.Consecutive(count: 10, first: 0));
List<double> ys = new(Generate.RandomSample(10));
// X と Y のリストから信号プロットを作成する
myPlot.Add.SignalXY(xs, ys);
// データは後からリストに追加できる
xs.AddRange(Generate.Consecutive(count: 10, first: 50));
ys.AddRange(Generate.RandomSample(10));
myPlot.SavePng("demo.png", 400, 300);
SignalXY DateTime 軸
SignalXY DateTime 軸
SignalXY プロットは、DateTime 水平軸を使用して、不均一な間隔の時系列データを表示できます。
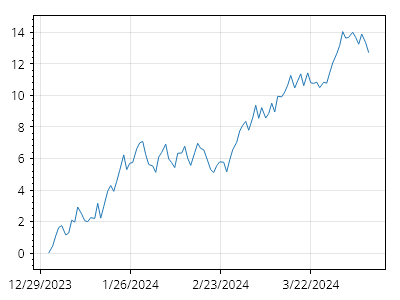
ScottPlot.Plot myPlot = new();
DateTime start = new(2024, 01, 01);
DateTime[] xs = Generate.ConsecutiveDays(100, start);
double[] ys = Generate.RandomWalk(100);
myPlot.Add.SignalXY(xs, ys);
myPlot.Axes.DateTimeTicksBottom();
myPlot.SavePng("demo.png", 400, 300);
部分的な SignalXY レンダリング
部分的な SignalXY レンダリング
SignalXY プロットが大きなデータ配列を参照している場合でも、レンダリングを値の範囲に制限できます。設定すると、最小レンダリングインデックスと最大レンダリングインデックスの間にあるデータ範囲のみが表示されます。
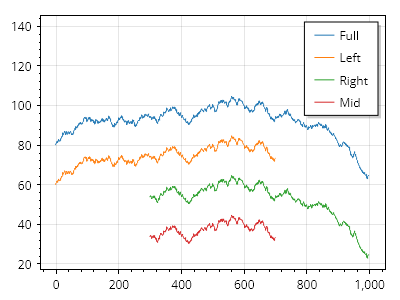
ScottPlot.Plot myPlot = new();
double[] xs = Generate.Consecutive(1000);
double[] ys = Generate.RandomWalk(1000);
var sigAll = myPlot.Add.SignalXY(xs, ys);
sigAll.LegendText = "全体";
sigAll.Data.YOffset = 80;
var sigLeft = myPlot.Add.SignalXY(xs, ys);
sigLeft.LegendText = "左";
sigLeft.Data.YOffset = 60;
sigLeft.Data.MaximumIndex = 700;
var sigRight = myPlot.Add.SignalXY(xs, ys);
sigRight.LegendText = "右";
sigRight.Data.YOffset = 40;
sigRight.Data.MinimumIndex = 300;
var sigMid = myPlot.Add.SignalXY(xs, ys);
sigMid.LegendText = "中央";
sigMid.Data.YOffset = 20;
sigMid.Data.MinimumIndex = 300;
sigMid.Data.MaximumIndex = 700;
myPlot.ShowLegend(Alignment.UpperRight);
myPlot.Axes.Margins(top: .5);
myPlot.SavePng("demo.png", 400, 300);
SignalXY オフセット
SignalXY オフセット
固定オフセットを SignalXY プロットに適用できます。
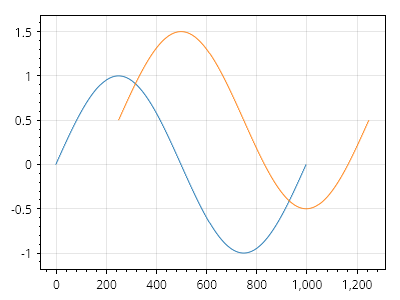
ScottPlot.Plot myPlot = new();
double[] xs = Generate.Consecutive(1000);
double[] ys = Generate.Sin(1000);
var sig1 = myPlot.Add.SignalXY(xs, ys);
var sig2 = myPlot.Add.SignalXY(xs, ys);
sig2.Data.XOffset = 250;
sig2.Data.YOffset = .5;
myPlot.SavePng("demo.png", 400, 300);
SignalXY のスケーリング
SignalXY のスケーリング
SignalXY プロットは、ユーザー定義の量に従って垂直方向にスケーリングできます。
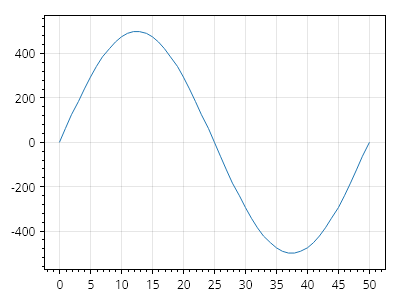
ScottPlot.Plot myPlot = new();
// -1 から 1 までの値をプロットする
double[] values = ScottPlot.Generate.Sin(51);
double[] xs = ScottPlot.Generate.Consecutive(51);
var signalXY = myPlot.Add.SignalXY(xs, values);
// 垂直方向のスケーリングを増やす
signalXY.Data.YScale = 500;
myPlot.SavePng("demo.png", 400, 300);
垂直 SignalXY
垂直 SignalXY
SignalXY プロットは通常、データを左から右へ表示しますが、このプロットタイプを使用してデータを下から上へ表示することもできます。
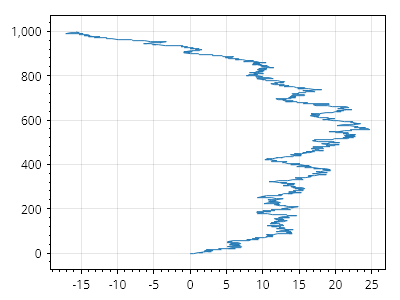
ScottPlot.Plot myPlot = new();
double[] xs = Generate.Consecutive(1000);
double[] ys = Generate.RandomWalk(1000);
var sig1 = myPlot.Add.SignalXY(xs, ys);
sig1.Data.Rotated = true;
myPlot.SavePng("demo.png", 400, 300);
X 軸が反転した垂直 SignalXY
X 軸が反転した垂直 SignalXY
回転した SignalXY プロット(下から上へ進むようにする)を、反転した水平軸(正の値が左側にある)上にも表示する方法を示します。
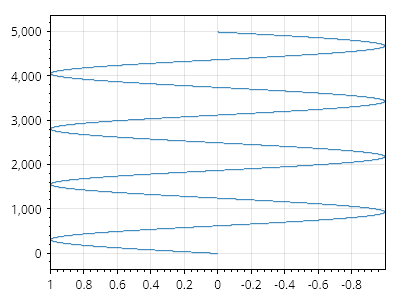
ScottPlot.Plot myPlot = new();
// シグナルプロットを追加する
double[] xs = Generate.Consecutive(5_000);
double[] ys = Generate.Sin(count: xs.Length, oscillations: 4);
// 垂直になるように回転する
var signal = myPlot.Add.SignalXY(xs, ys);
signal.Data.Rotated = true;
// 水平軸を反転する
myPlot.Axes.SetLimitsX(1, -1);
myPlot.SavePng("demo.png", 400, 300);
Y 軸を反転した垂直 SignalXY
Y 軸を反転した垂直 SignalXY
データが上から下へ進むように、反転した垂直軸上に回転した SignalXY プロットを表示する方法を示します。
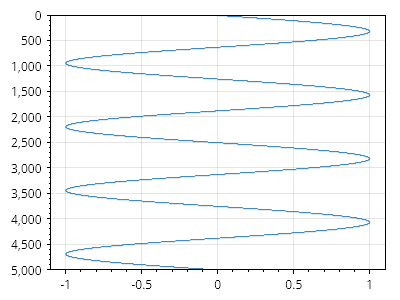
ScottPlot.Plot myPlot = new();
// 信号プロットを追加する
double[] xs = Generate.Consecutive(5_000);
double[] ys = Generate.Sin(count: xs.Length, oscillations: 4);
// 垂直になるように回転する
var signal = myPlot.Add.SignalXY(xs, ys);
signal.Data.Rotated = true;
// 垂直軸を反転する
myPlot.Axes.SetLimitsY(5000, 0);
myPlot.SavePng("demo.png", 400, 300);
マーカー付き SignalXY
マーカー付き SignalXY
ユーザーは、各データポイントにマーカーを表示するように有効化できます。ただし、非常に大きなデータセットではパフォーマンスが低下する可能性があります。
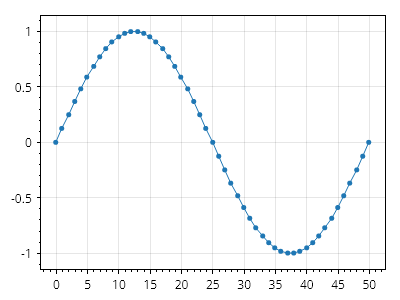
ScottPlot.Plot myPlot = new();
double[] xs = Generate.Consecutive(51);
double[] ys = Generate.Sin(51);
var sig = myPlot.Add.SignalXY(xs, ys);
sig.MarkerStyle.Shape = MarkerShape.FilledCircle;
sig.MarkerStyle.Size = 5;
myPlot.SavePng("demo.png", 400, 300);
スミスチャート
Create a Smith chart axis and add it to the plot to display impedance of RF signals using a horizontal axis indicating resistance and vertical axis indicating reactance.
レシピ
Smith チャートのクイックスタート
Smith チャートのクイックスタート
プロットに Smith チャートを追加し、そのメソッドを使用してインピーダンスを、他のプロットコンポーネントの配置に使用できるデカルト座標に変換します。
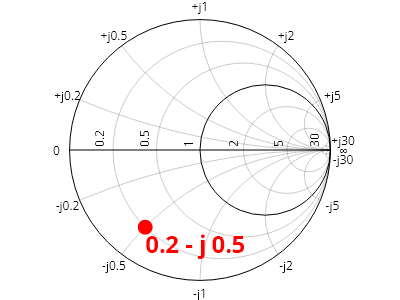
ScottPlot.Plot myPlot = new();
var smith = myPlot.Add.SmithChartAxis();
// Smith チャート上のインピーダンス位置をプロット上の 2D 位置に変換する
double resistance = 0.2;
double reactance = -0.5;
Coordinates location = smith.GetCoordinates(resistance, reactance);
// その位置を使用して従来のプロットコンポーネントを追加する
myPlot.Add.Marker(location, MarkerShape.FilledCircle, size: 15, Colors.Red);
var txt = myPlot.Add.Text("0.2 - j 0.5", location);
txt.LabelStyle.FontSize = 24;
txt.LabelStyle.Bold = true;
txt.LabelStyle.ForeColor = Colors.Red;
myPlot.SavePng("demo.png", 400, 300);
テキスト
Text labels can be placed on the plot in coordinate space
レシピ
Text クイックスタート
Text クイックスタート
テキストは座標空間の任意の場所に配置できます。
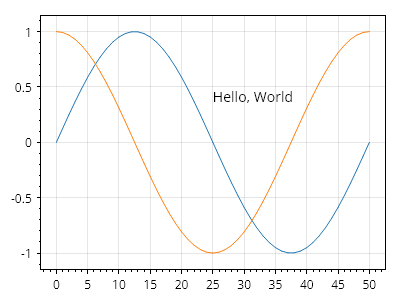
ScottPlot.Plot myPlot = new();
myPlot.Add.Signal(Generate.Sin());
myPlot.Add.Signal(Generate.Cos());
myPlot.Add.Text("Hello, World", 25, 0.5);
myPlot.SavePng("demo.png", 400, 300);
テキストの書式設定
テキストの書式設定
テキストの書式設定は幅広くカスタマイズできます。
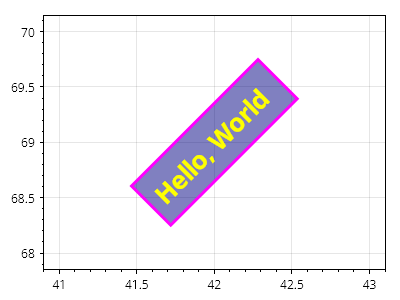
ScottPlot.Plot myPlot = new();
var text = myPlot.Add.Text("こんにちは、世界", 42, 69);
text.LabelFontSize = 26;
text.LabelBold = true;
text.LabelRotation = -45;
text.LabelFontColor = Colors.Yellow;
text.LabelBackgroundColor = Colors.Navy.WithAlpha(.5);
text.LabelBorderColor = Colors.Magenta;
text.LabelBorderWidth = 3;
text.LabelPadding = 10;
text.LabelAlignment = Alignment.MiddleCenter;
myPlot.SavePng("demo.png", 400, 300);
行の高さ
行の高さ
複数行ラベルには、書体とフォントサイズから推定されるデフォルトの行の高さがありますが、ユーザーが行の高さを手動で定義することもできます。
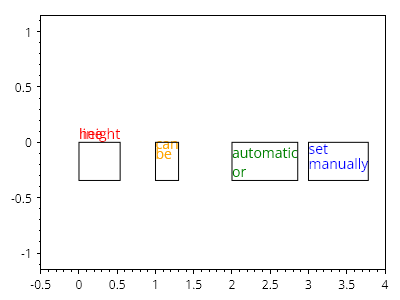
ScottPlot.Plot myPlot = new();
var label1 = myPlot.Add.Text($"行の\n高さ", 0, 0);
label1.LabelLineSpacing = 0;
label1.LabelFontColor = Colors.Red;
label1.LabelBorderColor = Colors.Black;
var label2 = myPlot.Add.Text($"設定\n可能", 1, 0);
label2.LabelLineSpacing = 10;
label2.LabelFontColor = Colors.Orange;
label2.LabelBorderColor = Colors.Black;
var label3 = myPlot.Add.Text($"自動\nまたは", 2, 0);
label3.LabelLineSpacing = null;
label3.LabelFontColor = Colors.Green;
label3.LabelBorderColor = Colors.Black;
var label4 = myPlot.Add.Text($"手動で\n設定", 3, 0);
label4.LabelLineSpacing = 15;
label4.LabelFontColor = Colors.Blue;
label4.LabelBorderColor = Colors.Black;
myPlot.HideGrid();
myPlot.Axes.SetLimitsX(-.5, 4);
myPlot.SavePng("demo.png", 400, 300);
テキストオフセット
テキストオフセット
オフセットプロパティを使用すると、テキストの位置をピクセル単位で微調整できます
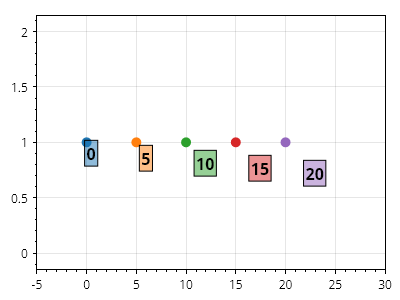
ScottPlot.Plot myPlot = new();
for (int i = 0; i < 25; i += 5)
{
// 点にマーカーを配置する
var marker = myPlot.Add.Marker(i, 1);
// 点にスタイル付きテキストラベルを配置する
var txt = myPlot.Add.Text($"{i}", i, 1);
txt.LabelFontSize = 16;
txt.LabelBorderColor = Colors.Black;
txt.LabelBorderWidth = 1;
txt.LabelPadding = 2;
txt.LabelBold = true;
txt.LabelBackgroundColor = marker.Color.WithAlpha(.5);
// 指定されたピクセル数だけテキストラベルをオフセットする
txt.OffsetX = i;
txt.OffsetY = i;
}
myPlot.Axes.SetLimitsX(-5, 30);
myPlot.SavePng("demo.png", 400, 300);
ツールチップ
Tooltips are annotations that point to an X/Y coordinate on the plot.
レシピ
Tooltip クイックスタート
Tooltip クイックスタート
ツールチップは、プロット上の X/Y 座標を指し示す注釈です。
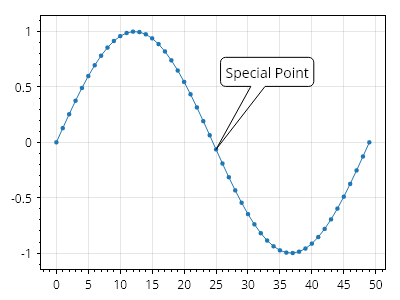
ScottPlot.Plot myPlot = new();
double[] ys = Generate.Sin(50);
var plt = myPlot.Add.Signal(ys);
plt.MaximumMarkerSize = 20;
Coordinates tip = new(25, ys[25]);
Coordinates label = tip.WithDelta(8, .7);
myPlot.Add.Tooltip(tip, "特別な点", label);
myPlot.SavePng("demo.png", 400, 300);
ツールチップラベルのスタイル設定
ツールチップラベルのスタイル設定
ツールチップのフォントはカスタマイズできます。
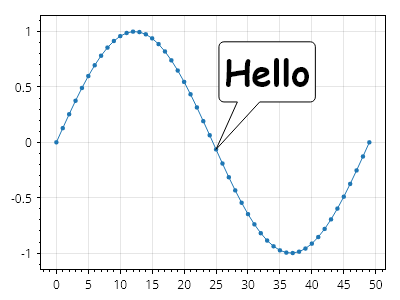
ScottPlot.Plot myPlot = new();
double[] ys = Generate.Sin(50);
var plt = myPlot.Add.Signal(ys);
plt.MaximumMarkerSize = 20;
Coordinates tip = new(25, ys[25]);
Coordinates label = tip.WithDelta(8, .7);
var tooltip = myPlot.Add.Tooltip(tip, "こんにちは", label);
tooltip.LabelFontName = "Comic Sans MS";
tooltip.LabelFontSize = 36;
tooltip.LabelBold = true;
myPlot.SavePng("demo.png", 400, 300);
ツールチップの色
ツールチップの色
ツールチップの境界線と塗りつぶしのスタイルはカスタマイズできます。
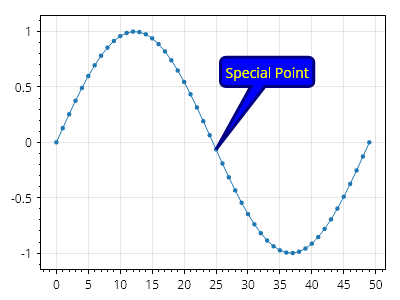
ScottPlot.Plot myPlot = new();
double[] ys = Generate.Sin(50);
var plt = myPlot.Add.Signal(ys);
plt.MaximumMarkerSize = 20;
Coordinates tip = new(25, ys[25]);
Coordinates label = tip.WithDelta(8, .7);
var tooltip = myPlot.Add.Tooltip(tip, "Special Point", label);
tooltip.FillColor = Colors.Blue;
tooltip.LineColor = Colors.Navy;
tooltip.LineWidth = 3;
tooltip.LabelFontColor = Colors.Yellow;
myPlot.SavePng("demo.png", 400, 300);
ツールチップのテール幅
ツールチップのテール幅
カスタマイズ可能なツールチップのテール幅の割合です。テールの実際の幅は、ツールチップ本体の長さまたは幅のうち小さい方になります。
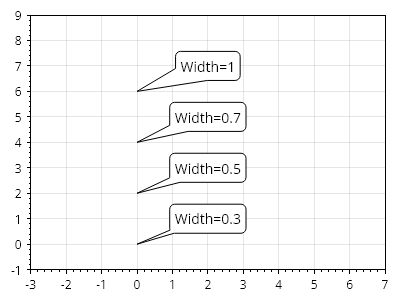
ScottPlot.Plot myPlot = new();
double[] widthFraction = [0.3, 0.5, 0.7, 1.0];
for (int i = 0; i < widthFraction.Length; i++)
{
Coordinates tip = new(0, i * 2);
Coordinates label = tip.WithDelta(2, 1);
var tooltip = myPlot.Add.Tooltip(tip, $"幅={widthFraction[i]}", label);
tooltip.TailWidthPercentage = widthFraction[i];
}
myPlot.Axes.SetLimits(-3, 7, -1, 9);
myPlot.SavePng("demo.png", 400, 300);
ツールチップの角度
ツールチップの角度
ツールチップの形状は、ラベルに対する先端の位置に応じて自動的に調整されます。
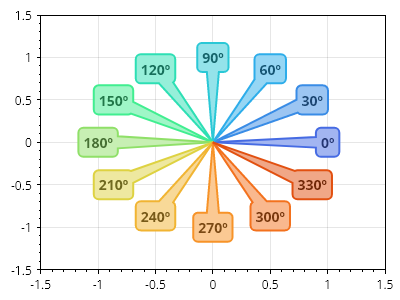
ScottPlot.Plot myPlot = new();
for (int i = 0; i < 360; i += 30)
{
Coordinates tip = new(0, 0);
PolarCoordinates polar = new(1, Angle.FromDegrees(i));
Coordinates label = polar.ToCartesian();
var tooltip = myPlot.Add.Tooltip(tip, $"{i}º", label);
tooltip.FillColor = Colormap.Default.GetColor(i, 360).Lighten(0.5);
tooltip.LineColor = Colormap.Default.GetColor(i, 360);
tooltip.LineWidth = 2;
tooltip.LabelBold = true;
tooltip.LabelFontColor = Colormap.Default.GetColor(i, 360).Darken(0.5);
}
myPlot.Axes.SetLimits(-1.5, 1.5, -1.5, 1.5);
myPlot.SavePng("demo.png", 400, 300);
三角軸
Create a triangular axis and add it to the plot to display data on a triangular coordinate system.
レシピ
Triangular Axis クイックスタート
Triangular Axis クイックスタート
三角軸を作成してプロットに追加し、三角グリッド上にデータを表示します。また、三角単位を、任意のプロットタイプを上に配置するために使用できる直交座標に変換するために操作します。
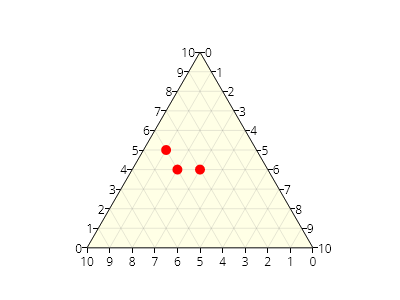
ScottPlot.Plot myPlot = new();
// 三角軸をプロットに追加する
var ta = myPlot.Add.TriangularAxis();
// 三角空間内のさまざまな位置から点を取得する
Coordinates[] points = [
ta.GetCoordinates(0.50, 0.40),
ta.GetCoordinates(0.60, 0.40),
ta.GetCoordinates(0.65, 0.50),
];
// 任意のプロットタイプを三角軸の上に追加できる
myPlot.Add.Markers(points, MarkerShape.FilledCircle, 10, Colors.Red);
myPlot.SavePng("demo.png", 400, 300);
三角軸の反転
三角軸の反転
三角軸は一般的な用途では通常、時計回り方向に増加しますが、地質学用途では反時計回りのラベル付けを持つ三角プロットが使用されることもあります。
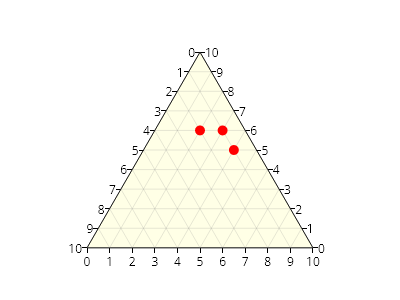
ScottPlot.Plot myPlot = new();
// 反時計回りの三角軸をプロットに追加する
var ta = myPlot.Add.TriangularAxis(clockwise: false);
// 三角空間内のさまざまな位置から点を取得する
Coordinates[] points = [
ta.GetCoordinates(0.50, 0.40),
ta.GetCoordinates(0.60, 0.40),
ta.GetCoordinates(0.65, 0.50),
];
// 任意のプロットタイプを三角軸の上に追加できる
myPlot.Add.Markers(points, MarkerShape.FilledCircle, 10, Colors.Red);
myPlot.SavePng("demo.png", 400, 300);
三角軸のスタイル設定
三角軸のスタイル設定
三角軸の背景とグリッド線はカスタマイズできます。
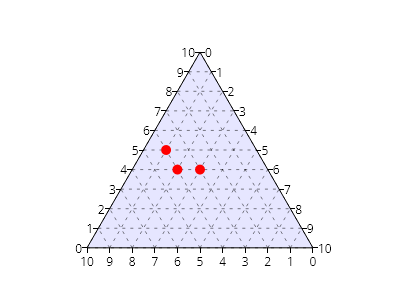
ScottPlot.Plot myPlot = new();
var ta = myPlot.Add.TriangularAxis();
// 背景をカスタマイズする
ta.FillStyle.Color = Colors.Blue.WithAlpha(.1);
// グリッド線をカスタマイズする
ta.GridLineStyle.Color = Colors.Black.WithAlpha(.5);
ta.GridLineStyle.Pattern = LinePattern.Dotted;
// サンプルデータを追加する
Coordinates[] points = [
ta.GetCoordinates(0.50, 0.40),
ta.GetCoordinates(0.60, 0.40),
ta.GetCoordinates(0.65, 0.50),
];
myPlot.Add.Markers(points, MarkerShape.FilledCircle, 10, Colors.Red);
myPlot.SavePng("demo.png", 400, 300);
三角軸のエッジのスタイリング
三角軸のエッジのスタイリング
エッジ線、目盛り、目盛りラベル、タイトルテキストのスタイリングオプションは、各軸に対して個別にカスタマイズできます。
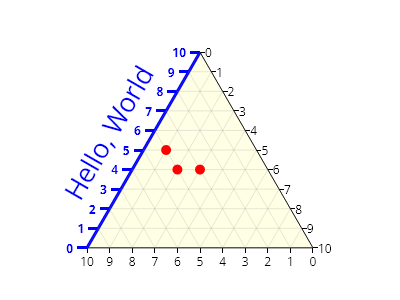
ScottPlot.Plot myPlot = new();
var ta = myPlot.Add.TriangularAxis();
// エッジ線は一方の角からもう一方の角まで伸びます
ta.Left.EdgeLineStyle.Width = 3;
ta.Left.EdgeLineStyle.Color = Colors.Blue;
// 目盛りラベルと目盛りは個別にスタイル設定できます
ta.Left.TickLabelStyle.ForeColor = Colors.Blue;
ta.Left.TickMarkStyle.Color = Colors.Blue;
ta.Left.TickMarkStyle.Width = 3;
ta.Left.TickOffset = new(-10, 0);
ta.Left.TickLabelStyle.Bold = true;
ta.Left.TickLabelStyle.OffsetX = -4;
// 軸タイトルを追加してスタイル設定できます
ta.Left.LabelText = "Hello, World";
ta.Left.LabelStyle.ForeColor = Colors.Blue;
ta.Left.LabelStyle.FontSize = 26;
ta.Left.LabelStyle.Bold = false;
ta.Left.LabelStyle.OffsetX = -20;
// サンプルデータを追加
Coordinates[] points = [
ta.GetCoordinates(0.50, 0.40),
ta.GetCoordinates(0.60, 0.40),
ta.GetCoordinates(0.65, 0.50),
];
myPlot.Add.Markers(points, MarkerShape.FilledCircle, 10, Colors.Red);
myPlot.SavePng("demo.png", 400, 300);
三角軸タイトル
三角軸タイトル
三角軸の辺には、タイトルを簡単に追加し、すべての辺コンポーネントに同様に色を付けるためのヘルパーメソッドがあります。
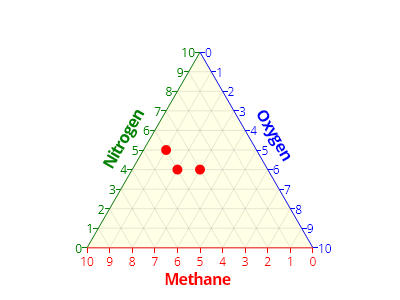
ScottPlot.Plot myPlot = new();
var ta = myPlot.Add.TriangularAxis();
// 各軸にタイトルと色を指定する
ta.Bottom.Title("Methane", Colors.Red);
ta.Left.Title("Nitrogen", Colors.Green);
ta.Right.Title("Oxygen", Colors.Blue);
// サンプルデータを追加する
Coordinates[] points = [
ta.GetCoordinates(0.50, 0.40),
ta.GetCoordinates(0.60, 0.40),
ta.GetCoordinates(0.65, 0.50),
];
myPlot.Add.Markers(points, MarkerShape.FilledCircle, 10, Colors.Red);
myPlot.SavePng("demo.png", 400, 300);
ベクトル場
Vector fields display a collection of vectors rooted at points in coordinate space
レシピ
ベクトル場クイックスタート
ベクトル場クイックスタート
ベクトル(大きさと方向を表す)は、座標空間内の特定の点に配置して、ベクトル場として表示できます。
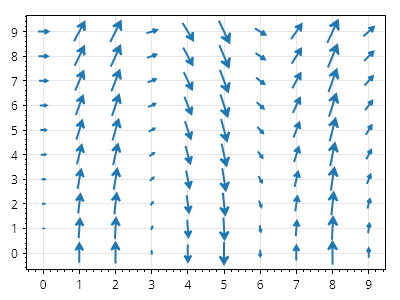
ScottPlot.Plot myPlot = new();
// 位置のグリッドを生成する
double[] xs = Generate.Consecutive(10);
double[] ys = Generate.Consecutive(10);
// ベクトルのコレクションを作成する
List<RootedCoordinateVector> vectors = new();
for (int i = 0; i < xs.Length; i++)
{
for (int j = 0; j < ys.Length; j++)
{
// グリッド上の点
Coordinates pt = new(xs[i], ys[j]);
// 方向と大きさ
float dX = (float)ys[j];
float dY = -9.81f / 0.5f * (float)Math.Sin(xs[i]);
System.Numerics.Vector2 v = new(dX, dY);
// コレクションに追加する
RootedCoordinateVector vector = new(pt, v);
vectors.Add(vector);
}
}
// 根付きベクトルのコレクションをベクトル場としてプロットする
myPlot.Add.VectorField(vectors);
myPlot.SavePng("demo.png", 400, 300);
ベクトル場のカラーマップ
ベクトル場のカラーマップ
ベクトル場の矢印は、その大きさに応じて色付けできます。
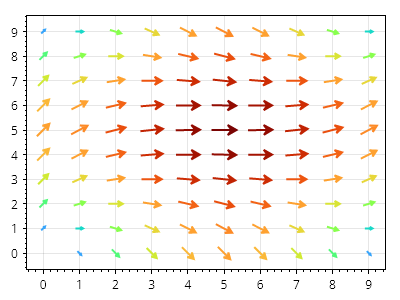
ScottPlot.Plot myPlot = new();
RootedCoordinateVector[] vectors = Generate.SampleVectors();
var vf = myPlot.Add.VectorField(vectors);
vf.Colormap = new ScottPlot.Colormaps.Turbo();
myPlot.SavePng("demo.png", 400, 300);
ベクトル場の矢印の長さ
ベクトル場の矢印の長さ
ベクトル場の矢印の長さは、最長のベクトルを表示する長さ(ピクセル単位)を定義することでカスタマイズできます。
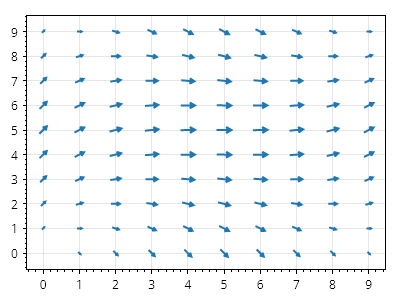
ScottPlot.Plot myPlot = new();
RootedCoordinateVector[] vectors = Generate.SampleVectors();
var vf = myPlot.Add.VectorField(vectors);
vf.MaximumArrowLength = 15;
myPlot.SavePng("demo.png", 400, 300);
api
レシピ
ScottPlot 5.1.58 API
Generated 3/29/2026 7:20:38 AM
<typeparam name="T"><inheritdoc cref="F:ScottPlot.GenericComparer`1.Default" path="/remarks" /></typeparam></div>
<remarks>
If the type is supported, this will be either <see cref="F:ScottPlot.BinarySearchComparer.Instance" /> or <see cref="P:System.Collections.Generic.Comparer`1.Default" />
<br /> If the type is unsupported, throws <see cref="T:System.TypeInitializationException" />
<para /> Supported Types :
<br /> - All primitive types
<br /> - Types comparable via <see cref="F:ScottPlot.BinarySearchComparer.Instance" />
<br /> - Types that implement <see cref="T:System.IComparable`1" />
</remarks></span></div>
<returns></returns></span></div>
<remarks>
If omitted, the ticks will start from <see cref="P:ScottPlot.IAxis.Min" />. This may have undesirable effects when zooming
and panning. If provided, the ticks will start from the returned DateTime.
</remarks>
<example>
If the plot contains weekly data, and it is desired to have ticks on the 1st of each month:
<code>
dt => new DateTime(dt.Year, dt.Month, 1);
</code>
If the plot contains hourly data, and it is desired to have ticks every 6 hours at 00:00, 6:00, 12:00, etc,
then set <see cref="P:ScottPlot.TickGenerators.DateTimeFixedInterval.Interval" /> to <see cref="T:ScottPlot.TickGenerators.TimeUnits.Hour" />, <see cref="P:ScottPlot.TickGenerators.DateTimeFixedInterval.IntervalsPerTick" /> to 6, and provide the function:
<code>
dt => new DateTime(dt.Year, dt.Month, dt.Day);
</code>
</example></span></div>
<param name="device">What the user engaged with</param>
<param name="description">What the user did to the device</param></div>