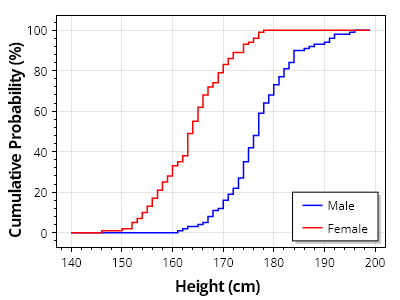
累積確率ヒストグラム
累積確率ヒストグラムは、各ビンまでの確率または相対度数の累積和を表し、確率分布の累計を示します。これは、複数の母集団の分布を評価および比較する場合に特に有用です。
ScottPlot.Plot myPlot = new();

// 値のコレクションからヒストグラムを作成する
double[][] heightsByGroup = { SampleData.MaleHeights(100), SampleData.FemaleHeights(100) };
string[] groupNames = { "男性", "女性" };
Color[] groupColors = { Colors.Blue, Colors.Red };

for (int i = 0; i < 2; i++)
{
    var hist = ScottPlot.Statistics.Histogram.WithBinSize(1, firstBin: 140, lastBin: 200);
    hist.AddRange(heightsByGroup[i]);

    var curve = myPlot.Add.ScatterLine(hist.Bins, hist.GetCumulativeProbability(100));
    curve.LineWidth = 1.5f;
    curve.LineColor = groupColors[i];
    curve.LegendText = groupNames[i];
    curve.ConnectStyle = ConnectStyle.StepVertical;
}

// プロットのスタイルをカスタマイズする
myPlot.Legend.Alignment = Alignment.LowerRight;
myPlot.YLabel("累積確率 (%)");
myPlot.XLabel("身長 (cm)");

myPlot.SavePng("demo.png", 400, 300);
このレシピは、ヒストグラムカテゴリに含まれる多数のレシピの 1 つです