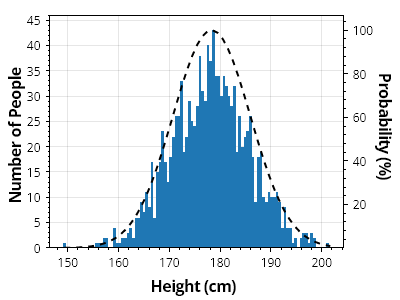
第2軸の確率を持つヒストグラム
確率曲線を第2軸に配置することで、カウントをパーセント単位の確率と並べて表示できます
ScottPlot.Plot myPlot = new();

// 値のコレクションからヒストグラムを作成する
double[] heights = SampleData.MaleHeights();
var hist = ScottPlot.Statistics.Histogram.WithBinCount(100, heights);

// ヒストグラムを棒グラフとして表示する
var barPlot = myPlot.Add.Bars(hist.Bins, hist.Counts);

// 各棒のスタイルをカスタマイズする
foreach (var bar in barPlot.Bars)
{
    bar.Size = hist.FirstBinSize;
    bar.LineWidth = 0;
    bar.FillStyle.AntiAlias = false;
}

// 確率曲線を第2軸に追加する
ScottPlot.Statistics.ProbabilityDensity pd = new(heights);
double[] xs = Generate.Range(heights.Min(), heights.Max(), 1);
double[] ys = pd.GetYs(xs, 100);

var curve = myPlot.Add.ScatterLine(xs, ys);
curve.Axes.YAxis = myPlot.Axes.Right;
curve.LineWidth = 2;
curve.LineColor = Colors.Black;
curve.LinePattern = LinePattern.DenselyDashed;

// プロットのスタイルをカスタマイズする
myPlot.Axes.Margins(bottom: 0);
myPlot.YLabel("人数");
myPlot.XLabel("身長 (cm)");
myPlot.Axes.Right.Label.Text = "確率 (%)";

myPlot.SavePng("demo.png", 400, 300);
このレシピは、ヒストグラムカテゴリにある多数のレシピの1つです