カスタム時間ビンを使用した金融チャート
金融チャートでは、任意の時間スケールで価格範囲情報を表示できます。
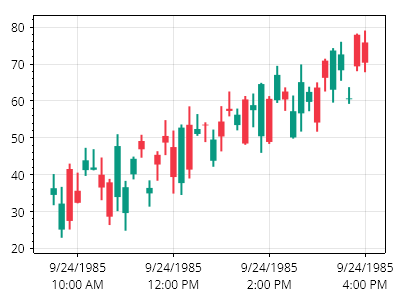
ScottPlot.Plot myPlot = new();

DateTime timeOpen = new(1985, 09, 24, 9, 30, 0); // 午前9:30
DateTime timeClose = new(1985, 09, 24, 16, 0, 0); // 午後4:00
TimeSpan timeSpan = TimeSpan.FromMinutes(10); // 10分間のビン

List<OHLC> prices = new();
for (DateTime dt = timeOpen; dt <= timeClose; dt += timeSpan)
{
    double open = Generate.RandomNumber(20, 40) + prices.Count;
    double close = Generate.RandomNumber(20, 40) + prices.Count;
    double high = Math.Max(open, close) + Generate.RandomNumber(5);
    double low = Math.Min(open, close) - Generate.RandomNumber(5);
    prices.Add(new OHLC(open, high, low, close, dt, timeSpan));
}

myPlot.Add.Candlestick(prices);
myPlot.Axes.DateTimeTicksBottom();

myPlot.SavePng("demo.png", 400, 300);
このレシピは、金融プロットカテゴリに含まれる多数のレシピの1つです