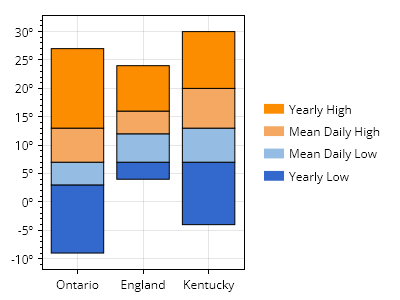
積み上げレンジチャート
積み上げレンジチャートは、離散的な項目の集合に対する複数の範囲を表します
ScottPlot.Plot myPlot = new();

// カスタムカラーパレットを準備する
string[] colorCodes = ["#3369cc", "#95bce3", "#f4a861", "#fd8d00"];
ScottPlot.Palettes.Custom palette = new(colorCodes);

// 名前付き範囲のコレクションを使用して積み上げ棒グラフを作成する
string[] rangeNames = ["Yearly Low", "Mean Daily Low", "Mean Daily High", "Yearly High"];
List<(string name, double[] edges)> ranges =
[
    ("Ontario", [-9, 3, 7, 13, 27]),
    ("England", [4, 7, 12, 16, 24]),
    ("Kentucky", [-4, 7, 13, 20, 30]),
];
myPlot.Add.StackedRanges(ranges, palette);

// 度数記号付きの目盛ラベルを使用する
ScottPlot.TickGenerators.NumericAutomatic tickGen = new();
myPlot.Axes.Left.TickGenerator = tickGen;
tickGen.LabelFormatter = (x) => $"{x}º";

// データ領域の外側に凡例を表示する
myPlot.ShowLegend(Edge.Right);

// 凡例に項目を手動で追加する
for (int i = 0; i < rangeNames.Length; i++)
{
    LegendItem item = new()
    {
        LabelText = rangeNames[i],
        FillColor = palette.GetColor(i),
    };
    myPlot.Legend.ManualItems.Add(item);
}
myPlot.Legend.ManualItems.Reverse();

// スタイルと配置を改善する
myPlot.Legend.OutlineStyle.IsVisible = false;
myPlot.Legend.ShadowColor = Colors.Transparent;
myPlot.Legend.Padding = new(0);
myPlot.Axes.Right.MaximumSize = 0;

myPlot.SavePng("demo.png", 400, 300);
このレシピは、棒プロットカテゴリにある多数のレシピのうちの1つです