カスタマイズされた棒グラフ
棒グラフのスタイル設定と配置を究極的に制御するには、各棒を個別に作成し、必要に応じてスタイルを設定し、その正確なサイズと位置を設定します。このレベルのカスタマイズを使用して、非常に高度な積み上げ棒グラフやグループ化棒グラフを作成できます。
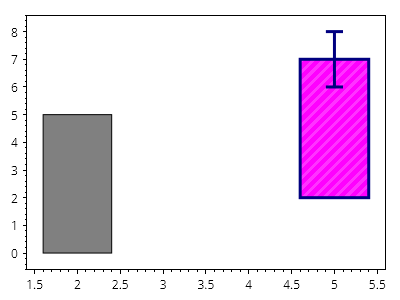
ScottPlot.Plot myPlot = new();

ScottPlot.Bar bar1 = new()
{
    Position = 2,
    Value = 5,
};

myPlot.Add.Bar(bar1);

ScottPlot.Bar bar2 = new()
{
    Position = 5,
    Value = 7,
    ValueBase = 2,
    Error = 1,
    FillColor = Colors.Magenta,
    LineWidth = 3,
    LineColor = Colors.Navy,
    FillHatch = new ScottPlot.Hatches.Striped(),
    FillHatchColor = Colors.Magenta.Lighten(.2),
};

myPlot.Add.Bar(bar2);

myPlot.HideGrid();

myPlot.SavePng("demo.png", 400, 300);
このレシピは、棒グラフカテゴリにある多数のレシピの 1 つです