手動カラーレンジ付きヒートマップ
ユーザーは、カラーマップで色として表現する値の範囲を定義できます。その範囲外の値は、カラーマップ内の最も近い色にクリップされます。
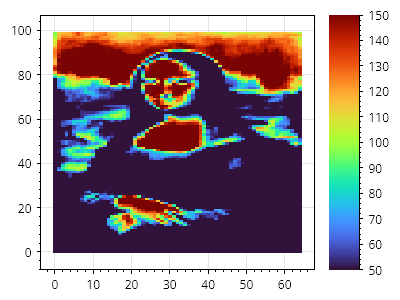
ScottPlot.Plot myPlot = new();

// サンプルデータの値の範囲は 0~255
double[,] data = SampleData.MonaLisa();

// ヒートマップとカラーバーをプロットに追加する
var hm = myPlot.Add.Heatmap(data);
hm.Colormap = new ScottPlot.Colormaps.Turbo();
myPlot.Add.ColorBar(hm);

// カラーマップが手動の値範囲にまたがるように強制する
hm.ManualRange = new(50, 150);

myPlot.SavePng("demo.png", 400, 300);
このレシピは、ヒートマップカテゴリーに含まれる多くのレシピの 1 つです