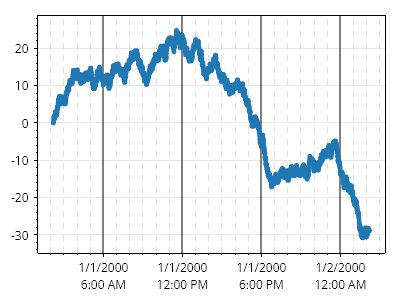
DateTime 軸の固定間隔目盛り
目盛りを固定間隔でレンダリングします。必要に応じて、プロットの開始日時を使用するのではなく、カスタム開始日時から目盛りをレンダリングできます(例: 毎時ちょうどに目盛りを描画する、毎月1日に目盛りを描画する、など)。
ScottPlot.Plot myPlot = new();

// 24時間分のサンプル DateTime データをプロットします(1分ごとに1点)
DateTime[] dates = Generate.ConsecutiveMinutes(24 *60, new DateTime(2000, 1, 1, 2, 12, 0));
double[] ys = Generate.RandomWalk(24* 60);
myPlot.Add.Scatter(dates, ys);
var dtAx = myPlot.Axes.DateTimeTicksBottom();

// 固定間隔の目盛りを作成します。大目盛りは6時間ごと、小目盛りは1時間ごとです
dtAx.TickGenerator = new ScottPlot.TickGenerators.DateTimeFixedInterval(
    new ScottPlot.TickGenerators.TimeUnits.Hour(), 6,
    new ScottPlot.TickGenerators.TimeUnits.Hour(), 1,
    // ここでは、目盛りの開始位置をオーバーライドするデリゲートを指定します。この場合、大目盛りは
    // 00:00、06:00、12:00 などにし、小目盛りは毎時ちょうど、つまり1時間ごとにしたいので、午前0時から開始します。
    // このデリゲートを指定しない場合、目盛りは x 軸の Min が何であれそこから開始されます。
    // 大目盛りが午前1:30、午前7:30 などになる可能性があり、プロットをパンしても目盛り位置は
    // プロット上で固定されます。
    dt => new DateTime(dt.Year, dt.Month, dt.Day));

// 目盛りを見やすくするためにグリッド線をカスタマイズします
myPlot.Grid.XAxisStyle.MajorLineStyle.Color = Colors.Black.WithOpacity();
myPlot.Grid.XAxisStyle.MajorLineStyle.Width = 2;

myPlot.Grid.XAxisStyle.MinorLineStyle.Color = Colors.Gray.WithOpacity(0.25);
myPlot.Grid.XAxisStyle.MinorLineStyle.Width = 1;
myPlot.Grid.XAxisStyle.MinorLineStyle.Pattern = LinePattern.DenselyDashed;

// 小目盛りのラベルを削除します。そうしないと、目盛りラベルが大きく重なります
myPlot.RenderManager.RenderStarting += (s, e) =>
{
    Tick[] ticks = myPlot.Axes.Bottom.TickGenerator.Ticks;
    for (int i = 0; i < ticks.Length; i++)
    {
        if (ticks[i].IsMajor)
        {
            continue;
        }

        ticks[i] = new Tick(ticks[i].Position, "", ticks[i].IsMajor);
    }
};

myPlot.SavePng("demo.png", 400, 300);
このレシピは、軸と目盛りカテゴリにある多数のレシピの1つです